

Tibor László Buskó - Attila Jószai: Beginnings of Urbanization Processes as Exemplified by the Budapest Metropolitan Area (Publico, 2014/3., 61-72. o.)
Preface to a Historical Model of Urbanization
Abstract
Investigating Hungarian urbanization processes - especially when using the example of the Budapest Metropolitan Area - has been a central research topic of the Hungarian regional science discourse during the past decades. Research work increasingly contributed to better understanding of those urbanization processes, on the basis of a model of urbanization elaborated by Leo van den Berg and - as for the Hungarian literature - György Enyedi.
This article conceptualises the two most important approaches to urbanization, the evolutionary school of thought' and the 'historical school of thought'. The evolutionary school can be interpreted as a group of theories that identifies urbanization as a universal process of successive 'stages of urban development'. The historical school of thought is relatively unknown. This is because it does not concentrate on popular - and, sometimes, slightly simplistic - generalisations, but rather on characteristics of individual trajectories of urbanization Joining forces with the historical school. The present article tries to formulate a clearer notion of the urbanization development within the context of the recent Budapest Metropolitan Area during the period of 1900-1945. Using contemporary statistical publications, we built a database that helps to quantify the intensity of urbanization processes. We were able to distinguish communities falling under the 'immediate urbanization zone', communities falling under the 'broader urbanization zone' and communities that did not participate in any urbanization processes at all.
1. Introduction
The study of the urbanization processes observable in Hungary and within it in the Budapest Metropolitan Area has attracted the attention of a relatively broad range of Hungarian researchers in the past decades. The study of the phenomenon started in Hungary in the 70s, according to international urbanization research trends, then the inaugural address at the Hungarian Academy of Science by professor Enyedi in 1982, who passed away in 2012, was its milestone. The research projects mainly provided newer and newer contributions for the
- 61/62 -
examination of the urbanization processes occurring in the Budapest Metropolitan Area, based on the principles of the so-called evolutionary school of thought, related to the ability to observe phases in the processes of urbanization, elucidated by van den Berg and Drewett[1], subsequently further elaborated by György Enyedi[2] and later refined by several others. Professional literature discussing the subject primarily focused on the study of the periods, in the cases of which a sufficient amount of statistical data was available, which could perhaps be complemented by empirical research as well. Therefore a significantly greater emphasis has been placed on the examination of the processes of our times and of those twenty-thirty years ago, while the period before 1945 has received an unfairly small amount of attention.
Therefore our objective is to revise the dogmatic conclusions of the evolutionary school of thought related to the period, and if that is necessary to refute its conclusions, by elaborating a model with a historical viewpoint regarding the urbanization processes of the Budapest Metropolitan Area before 1945, in as much detail as possible. Because of all these, let's take a look at the differences between the principles of the historical and the evolutionary schools of thought!
The views of the historical school of thought are little known, perhaps primarily because they don't think in terms of models, general rules which can be schematized, they rather emphasize uniqueness. The historical school of thought can thank the appearance of the evolutionary school of thought for its inception, it is a reaction to that - in our opinion, in reality it only refines the conclusions of that in its interpretation framework system. Its representatives do not reject the phasing of the evolutionary school of thought, they merely maintain, that the intensity, the territorial extent, moreover in certain cases even the order of individual phases may be different from city to city, therefore it is not the city placed in the evolutionary model that is in the forefront of their views, rather the city's development phases themselves. Expressing these in words is not easy either, and even in our days there is not a complete agreement among the representatives of the view, whether typifying these urban development phases is even possible at all.[3] If this classification is implemented nevertheless, then it will possess a schematic characteristic similar to the phasing of the evolutionary school of thought, only according to a different structure. With this we may even prove that there is no problem with the modeling of urbanization processes themselves (which may be spatial or functional), the question rather is - to open a third front - how the urbanization of a Metropolitan Area can be uniformly observed, or is that even possible at all? Is it possible, in the case of a metropolis, for the urban development processes, which in each part of the city have different characteristics, intensity because of various - geographical, economic, environmental - reasons, to converge in the same direction, and then suddenly become smoothly adaptable into one of the well identifiable evolutionary phases? Meaning, that from the point of view of our surveyed area, we have to search for the answer in the phasing of the
- 62/63 -
evolutionary school of thought, while relying on the viewpoints of the historical school of thought, which emphasize uniqueness.
The urban ecology theory of the residents of Chicago proved to be sufficient for the study of the development processes of American cities until the end of the 1920s. However, at that time, new, previously unknown processes appeared, and spread in the next decades: the territory of cities expanded, while their population stagnated, or the pace of their development considerably slowed; special areas, so-called suburbs appeared in the vicinity of large cities. This meant a qualitatively new element; the process was designated by the extension of the concept of urbanization - as city development - with the addition of the prefix "sub" - "under", under something (the city). Thus the concept of suburbanization in its original form referred to the appearance of a residential ring outside of the city, farther away from it, the residents of which continued to take advantage of the central city's services, their workplaces were there, and their chosen place of residence was not in the same place only because of their desire for a more livable environment. However, subsequently the concept - compared to its original content - was significantly expanded.
The 'Alpha' of the distinction of urbanization phases is the Vienna report,[4] which differentiates four phases, concentration (classical urbanization, or "urban explosion"), the primary cause of which is practically exclusively industry,[5] where residents with insufficient mobility strive to settle in the vicinity of industrial areas. This is followed by suburbanization, which is divided into two further phases. The first one is relative concentration, in the case of which the city's population expansion slows caused by the surrounding towns, then the second phase, relative decentralization, when the population of the central city first stagnates, then it diminishes, and concurrently with this - even though at a reduced pace - the growth of the city ring still continues. In the third phase of development the reduction of the entire urban region's population is characteristic, desurbanization - which was later divided into two further phases by several researchers. In this phase the network of small towns in the broader - secondary - Metropolitan Area develops. From this point on the presumed development may diverge in two directions, one of these directions is reurbanization, meaning the filling of the residential areas of the inner city with residential function again, or the trend continues to centrifuge outward and creates a new growth pole, in which the city which was our starting point is only one player among many. During the period since the Vienna report models have been created which are sometimes practically identical with this division, diversified by insignificant additions, modifications[6] and sometimes somewhat -mainly related to the characteristics of the phases - different[7]. All of them, without an exception, take territorial concentration as the starting-point, the fundamental cause of which
- 63/64 -
is, that as a result of employment concentration in the higher level activities (industrial production stretching the conventional framework), concurrently the population is concentrated as well. And the concentration of residence occurs simultaneously with employment concentration but generally at different paces and to different degrees.[8] The study of societal, sociological changes should be at least equally important parts of the research of urbanization processes, but they are generally neglected. In consideration of these we have to highlight the change in the aspiration level regarding lifestyle, occupation and the environment of residence - they can only be examined circumstantially from a historical viewpoint -, as well as the opportunities for the research of residence migration, which promise significantly more diverse results than population trends. Only a few Hungarian researchers[9] call attention to the necessity for this, either specifically or with partial results of their work. In connection with the opinions regarding the characteristics of suburbanization the situation is more refined. One of the possible reasons for this may be that this process is considerably stretched in time therefore different viewpoints emerge in the course of empirical research projects conducted in different eras. On the other hand, suburbanization characteristics are sometimes more difficult to recognize from a historical perspective, just as in our times, desurbanizational, even reurbanizational characteristics may appear in the vicinity of Budapest, in the classical urbanization phase - according to the axioms in a far greater scale, that is generally accepted - we can observe the early commencement of suburban processes.
1. Methodology
Our study may be considered the first step in the research tracing the development of the recent Budapest agglomeration,[10] therefore we will construct our database taking every affected municipality into consideration. Regarding the starting-point of the study, of course, we are aware of the fact, that the fundamentals of urbanization processes were evident even in the last third of the 19[th] century in the vicinity of Budapest. The research projects of Károly Vörös (Spira-Vörös 1979) primarily called attention to the early urbanization of the Újpest-Rákospalota complex (the population of Újpest reached 42 thousand souls as early as at the turn of the century), and - even though to a lesser degree - similar trends can be observed at the three communities, which developed to the South, Erzsébetfalva, Kispest and Pestszentlőrinc as well. However, the scantiness of source material in the second half of the 19[th] century very simply would not have made a study based on detailed qualifications possible. Therefore we selected the period between 1901 and 1910 as the starting-point of our study (with respect to the difference of natural population increase and migration) and the
- 64/65 -
census moment of the census conducted on December 31[st], 1910 (with respect to other indicators), because we deemed our data sources sufficiently detailed from this point on.[11]
In a few cases the method of fitting the municipalities included in our census volumes into our database caused a special problem. Because the number of municipalities recorded at the time of the census differs from the current number in some places. The most significant difference was the establishment of Greater-Budapest, starting on January 1[st] 1950, because it made 23 formerly independent municipalities parts of Budapest. We indicated these municipalities in our database, according to the administrative conditions of 1949. However, in the case of other municipality mergers we strove to conform to the current administrative conditions: for example we combined the data of Őrszentmiklós and Vácbottyán even in the period between 1910 and 1941 under the name of "Őrbottyán", which didn't exist at the time yet. Municipalities becoming independent, which is rather frequent in our era, caused a larger problem (for example Pestszentlőrinc has only been an independent municipality since 1910, previously it was a part of Kispest). At the time of the first census following its independence - since the data regarding the difference of natural population increase/migration are not separately available to us in the entire period prior to it -we indicated the affected municipalities in our database still combined (in our example: in the form "Kispest + Pestszentlőrinc"). The case of Délegyháza also posed a special problem, since this municipality currently constituting a part of the Budapest agglomeration became independent only in 1950, from the municipality portions of Bugyi's part Alsódélegyháza, as well as Dabas' part Felsődélegyháza. For this reason, in this case as well we applied the Bugyi+Dabas+Délegyháza solution. Because of these problems at the presentation of the results of the study - especially where the smallest units of our study are not independent municipalities, rather merged municipality groups - instead of municipality we will use the term "study unit".
After this, letus take a look at what those variables are, which are available to us from the census of 1910, 1920, 1930 and 1941 alike, and - according to our base hypothesis - appropriately point out certain modernization trends. We may mention the following:
Natural population increase: since the reduction of the values of natural population increase can be considered as one of the indicators of modernization, according to our suspicion, in the case of those municipalities where the effect of modernization is more intense, the values of natural population increase will diminish. To filter out the influence of annual fluctuations, in the course of the study in every case we considered the ten year average of values of natural population increase (thus, in the case of the year 1910, we took the average of the period between 1901 and 1910).
Migration difference: the migrants arriving from the city probably also indicate modernization. To filter out the influence of annual fluctuations, in the case of migration difference, we also considered the ten year average values.
- 65/66 -
Proportion of agricultural employees: in the most developed municipalities with industrial characteristics, as well as in the laborer, office-employee and vacation settlements, the proportion of agricultural employees will obviously be extremely low. Therefore an inverse proportionality can be considered probable between the proportion of agricultural employees and the degree of modernization.
Literacy rate: in the era of our study illiteracy had not been reduced to the point, that from the illiteracy rate we wouldn't be able to draw conclusions regarding the general educational conditions of the population. According to our suspicion, in the municipalities where modernization is more advanced, the proportion of the literate population will be higher as well.
Proportion of stone and brick houses: obviously modernization must be reflected in the general scene of the municipality as well. Therefore, according to our suspicion, the houses built from unburned brick, mud and various mixed construction materials, will be replaced by stone and brick constructed buildings with the advancement of urbanization.
If we study the trend of our variables constituting our database between 1910 and 1941 one by one, in comparison with the conditions in Hungary (TABLE 1), we can undoubtedly establish as much that some kind of modernization process unquestionably occurred between the starting-point and the end-point of the study.
Table 1 Indicators of modernization in the communities of the recent Budapest Metropolitan Area (1910-1941)
| Natural growth yearly average (%o) 1901-1910; | Migration change yearly average (%) 1901-1910; 1930-1941 | Employees in agriculture (%) | Per cent of people knowing to read and write in the population above 6 years (%) | Stone- and brick houses (%) | |
| Budapest agglomeration, 1910 | 17,8 | 17,2 | 51 | 83,5 | 34,1 |
| Hungary, 19101 | 12,2 | -1,1 | 57,2 | 82,8 | 22,1 |
| Budapest agglomeration, 1941 | 5,8 | 14,2 | 36,7 | 94,6 | 62,2 |
| Hungary, 1941 | 7,3 | 0,8 | 48,9 | 92,4 | 27,7 |
1 In the case of stone and brick constructed buildings, the data refers to the territory before the end of World War I. In other cases they refer to the current territory of Hungary.
(SOURCE: OUR OWN CALCULATIONS BASED ON CENTRAL STATISTICAL OFFICE DATA)
Decrease in the birth rate and the ratio of agricultural workers and the growth of the ratio of literacy and the stone and brick built houses unambiguously point to the advancement
- 66/67 -
of modernization. In fact, the same is true about the net migration rate values, which can be regarded as the indicator determining the urbanization process: although the net migration rate somewhat decreased in the 1930-1941's compared to the 1900-1910 period, the immigration surplus still remained significant. And if we add that the total population of our study area increased by 160,726 people between 1930 and 1941 (the same value between 1900 and 1910 was only 141,266 people even at a much higher natural population increase rate), the trend seems even more evident, if possible.
However, it does not become evident how much this growth is due to the proximity of Budapest (in other words, to the urbanization process referred to in the title) simply by proving our statement related to modernization in general terms. It appears that if we succeed in pointing out the geographical variation of modernization processes in our studied area, as well as in concluding the connection between these inequalities and the effect of the proximity of Budapest, then our hypothesis is also proven regarding the emergence of urbanization between 1910 and 1941. For this purpose, however, we will need a deeper analysis than the one conducted thus far of the variables in our study. How should we conduct such an analysis?
We suggest the following method. First, we must suppose that such a variable exists that will help us reveal the statuses of the above-mentioned modernization processes in the various communities comprised in our data base. Since there is no census dating back to the period which would reveal such a modernization variable, it can only be a latent variable that we create from the real variables in our census data sources with the use of some multivariate mathematical-statistical method. We realized this task using principal component analysis
- one of the most widely used data reduction processes. Without going into further mathematical details of the process, it should simply be noted that a principal component analysis is considered successful only if:
- the variables closely fit - as agreed, at least with a minimum 0.25 communality value - to our principal component,
- the principal component retains a fairly high ratio - as agreed, at least 50% - of the heterogeneity of the variables.
2. Reporting results
Having regard of all this, we would like to present the results of the principal component analyses related to the study period. As it can be seen in Table 2, the modernization variables we selected, with the exception of two, meet the requirement of the principal component - perhaps. The results of the literacy rate in 1910 and of the natural population increase in 1920 are the only ones that are a loose fit to our principal component. Therefore, we had to exclude the incriminated variables from our principal component based on the data of the 1910 and 1920 censuses. In this way, the retained heterogeneity exceeds 50% in each case. In other words, below we can safely move on to verifying the emergence of the urbanization process.
- 67/68 -
Table 1 Results of the principal component analysis
| 1910 | 1920 | 1930 | 1941 | |
| Natural population increase%o - communality value (component matrix value) | 0.413 (0.643) | * * * | 0,469 (-0.685) | 0.582 (-0.763) |
| Net migration rate ‰ - communality value (component matrix value) | 0.791 (0.889) | 0.517 (0.719) | 0.554 (0.745) | 0.524 (0.724) |
| Agricultural workers ‰ - communality value (component matrix value) | 0.737 (-0.858) | 0.805 (-0.897) | 0,72 (-0.849) | 0.765 (-0.874) |
| Literacy ‰ - communality value (component matrix value) | * * * | 0.284 (0.533) | 0.5 (0.707) | 0.385 (0.621) |
| Stone/brick buildings ‰ - communality value (component matrix value) | 0.442 (0.665) | 0.526 (0.725) | 0.704 (0.839) | 0.727 (0.852) |
| Retained heterogeneity% | 59.56 | 53.29 | 58.96 | 59.66 |
(SOURCE: OUR OWN DATA BASED ON CENTRAL STATISTICAL OFFICE DATA)
In connection with this, we must point out another peculiarity. As it can be seen, another positive so-called matrix value[12] appears in parentheses next to the 0.413 communality value of natural population increase in 1910. This means that in the period between 1900 and 1910 - contrary to our hypothesis and subsequent results - there is still a positive-directed connection between natural population increase and modernization. In our opinion, this seemingly surprising result can be explained by the fact that in the period between 1900 and 1910 the values of natural population increase was still primarily determined by the higher fertility indicators of the younger generation relocating to communities involved in the modernization and not by the general modernization trends indicated in the hypothesis.
Verifying the existence of the urbanization processes becomes possible after printing the so-called principal component values. These provide the values of the "modernization variable" assigned to each community in a standardized format, from the communities most impacted by the modernization processes (highest value) to those least impacted (lowest value). Even if we compare the minimum and maximum values of the principal components of 1910 and 1941 only (1910 - maximum: 2,7149, minimum: -1,61971; 1941 - maximum: 2,27502, minimum: - 2,32387), it is evident that in our study period the difference between the communities most and least impacted by the modernization slightly increased. If we add that the changes taking place during the period, based on Table 1, applied their impact mainly in the direction of modernization, then we can conclude that the communities around Budapest became varied in the period between 1910 and 1941 due to the impact of modernization. The various modern-
- 68/69 -
ization tendencies impacted the different communities to various depths. In this way, we have arrived at the most crucial question of our study: How much of this variegation can be attributed to the effect of the proximity of Budapest; or in other words, how much can modernization be equated with urbanization in our study area?
For the answer, all we will demonstrate here is that a correlation can be shown between the proximity of the capital and the extent of modernization. For this, it is sufficient to take a look at the principal component values of the 23 communities located in close proximity to the capital that in 1950 were joined to the Greater Budapest Area. Since during our study period it never occurred that a community that was joined to the greater Budapest area in 1950 would be rendered a lower than average modernization value, urbanization and above average modernization can by-and-large be correlated - at least in our study period/area - to the same group of communities. Therefore, from now on we will use, under the name "urbanization variables," the modernization variables introduced earlier to determine the urbanization zones.
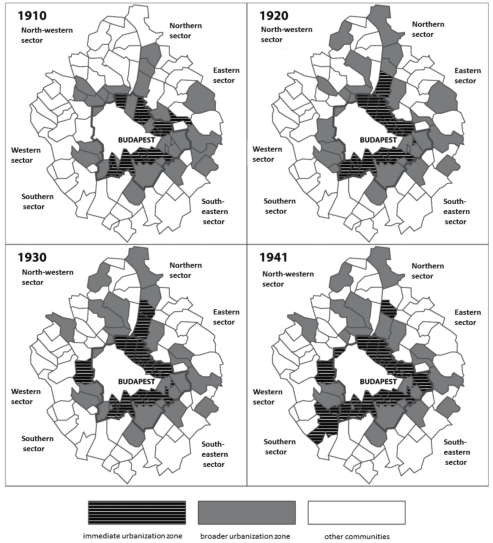
For this, we suggest the following simple method. After printing the principal component values, the communities having positive principal component values, i.e. the communities already showing urbanization tendencies (more strongly than what is typical for the area) can easily be selected. Then we subdivided the urbanization area revealed this way to an immediate and a broader urbanization zone in each case, in order to facilitate the harmonization of the findings of our study with the main view of the evolution school. For this purpose we broke down the territory defined by the highest and the lowest principal component values of the principal components created from the consensus data bases into three equal class intervals in each case, and then we identified the communities in the top third with the urbanization zone. The broader urbanization zone, logically, is defined by the group of communities excluded from the top third but still showing positive principal component values. The results gained in this way already reveal a great deal even in this extracted format about the extent and development of the urbanization area of the Budapest vicinity between 1910 and 1941 (c. f. Table 3, Map 1.).
Table 3 • Intensity of urbanization processes in the recent Budapest Metropolitan Area (19101941)
| Number of communities in the immediate urbanization zone | Number of communities in the broader urbanization zone | Number of communities excluded from the urbanization zone | |
| 1910 | 9 | 24 | 49 |
| 1920 | 16 | 23 | 47 |
| 1930 | 17 | 23 | 48 |
| 1941 | 22 | 21 | 46 |
(SOURCE: OUR OWN DATA BASED ON CENTRAL STATISTICAL OFFICE DATA)
- 69/70 -
Map 1 • Intensity of urbanization processes in the recent Budapest Metropolitan Area (19101941)
(SOURCE: OUR OWN DATA BASED ON CENTRAL STATISTICAL OFFICE DATA)
What is most conspicuous is that no significant shift is shown in the ratios of the urbanization zones and the communities excluded from the urbanization process recently. In other words, it can be said that - with a few exceptions - the communities included in the urbanization area in the beginning of our era remained in the urbanization area at the end of the era too, in the same way as communities outside the urbanization zone have not shift-
- 70/71 -
ed into the zone either.[13] A significant shift can be detected only between the immediate and the broader urbanization zones. At the same time, the nearly 250% increase of the number of communities included in the inner core did not correspond with a similar decrease rate in the number of communities in the broader urbanization area, which indicates that the majority of the shift can be explained by the fact that certain parts of the communities, that were parts of the immediate urbanization zone earlier too, became independent. In this way, the study unit comprising the Cinkota + Mátyásföld + Sashalom of 1910 became independent as Sashalom by 1941, the Kispest + Pestszentlőrinc study unit became Pestszentlőrinc, and the Rákospalota + Pestújhely study unit became independent as Pestújhely. The situation is similar in the case of the communities - which had probably already been undergoing significant urbanization - that became independent communities (Csömör Rákosszentmihály; Rákoskeresztúr Rákosliget, Rákoshegy; Sződ + Göd + Csörög + Sződliget Göd) comprising parts of the immediate urbanization zone by seceding from communities belonging in the broader urbanization zone in 1910. All of this demonstrates that only six communities - namely, Albertfalva, Budakeszi, Nagytétény, Pesthidegkút, Rákoscsaba and Újpest - ascended from the broader urbanization zone to the immediate urbanization zone between 1910 and 1941. Lastly, we must mention that in the cases of certain communities the descension from the immediate urbanization zone into the broader urbanization zone or from the broader urbanization zone into the group of communities excluded from the urbanization occurs. Naturally, in most cases the probable cause of this shift is not actual "degression" but rather certain peculiarities of the compilation of the data base. E. g. the descension of the Sződ+Csörög+Sződliget study unit is explained by the 1921 secession of the Alsógöd+Felsőgöd community areas that can be attributed with rather favorable urbanization indicators. In other cases, this peculiar phenomenon may be explained by the fact that the principal component indicators do not point to the absolute values of the urbanization but to the urbanization levels of the given communities in comparison to each other instead. In other words, a community experiencing urbanization may descend in the case that its development rate is slower than that of other communities undergoing more dynamic urbanization within the Budapest Metropolitan Area. On the other hand, the shift of these urbanization indicators can be verified or refuted only in one way, which comprises the task of the second part of our study. Specifically, by the detailed processing of local history information and the location-specific data, and the reproduction of the local development process as precisely as possible. If, then, in the period between 1910 and 1941 the group of communities in the Budapest vicinity became variegated as a result of the impact of modernization, then we can add: it is not ascension into one of the urbanization zones that is primarily responsible for this variegation but, much rather, the more dynamic modernization of the communities belonging to the immediate or the broader urbanization zones in comparison to the communities excluded from the urbanization.
- 71/72 -
3. Conclusion
From the results of our examination we can conclude that in the classical urbanization phase - according to the axioms in a far greater scale, that is generally accepted - we can observe the early commencement of suburban processes. The communities falling under the 'immediate urbanization zone', as well as the communities falling under the 'broader urbanization zone' can be interpreted - as early as during the period of 1900-1945 - as parts of a special suburban area. In any case, this study should be regarded as preliminary. In the future, the authors aim to collect 'raw material' for their future research, based chiefly on archival sources in order to better understand the character of that suburban processes emerged clearly even in the first half of the 20[th] century by distinguishing communities falling under 'industrial area', 'labourer, employee and holiday-maker colonies' and the 'agricultural supply area of the city'. However, this preliminary study - especially the spatial and chronological identification of zones - and the characteristics of their spreading - may be suitable for specifying a model of the so-called 'evolutionary school of thought' on urbanization phases by means of a historical approach. ■
NOTES
[1] van den Berg, Leo - Drewett, Robert - Klaassen, Leo H. - Rossi, Angelo - Vijverberg, Cornells H. T.: A Study of Growth and Decline. Pergamon Press, Oxford - New York, 1982. 162. p.
[2] Enyedi György: A városnövekedés szakaszai. Akadémiai Kiadó, Budapest, 1988. 115. p.
[3] Savage, Michael - Warde, Alan: Urban sociology, capitalism and modernity. Macmillan, London, 1993. 221. p.
[4] van den BERG, Leo - Drewett, Robert - Klaassen, Leo H. - Rossi, Angelo - Vijverberg, Cornells H. T.: A Study of Growth and Decline. Pergamon Press, Oxford - New York, 1982. 162. p.
[5] Only city development related to today's "third world" differs from this; in this case it's not industrial concentration, rather the crisis of rural regions that motivates the commencement of 'city explosion'.
[6] Tózsa István: Közigazgatási Urbanisztika I. - Településtan. Aula Kiadó, Budapest, 2011. 191. p.
[7] Izsák Éva: A városfejlődés természeti társadalmi tényezői - Budapest és környéke. Napvilág Kiadó, Budapest, 2003. 177. p.
[8] Tóth József: Az agglomerálódás stádiumai. In: Csapó Tamás - Kocsis Zsolt eds.: Agglomerációk és szuburbanizálódás Magyarországon. Savaria University Press, Szombathely, 2006. 6-15.
[9] Dövényi Zoltán - Kocsis Zoltán: A szuburbanizáció térbeni-társadalmi jellemzői Budapest környékén. Földrajzi Értesítő, 1999. 1-2. 33-57. p.
[10] The list of municipalities included in the Budapest agglomeration is in: Act LXXXVIII. of 2011 concerning the amendment of Act LXIV. of 2005 concerning the Municipality Construction Plan of the Budapest Agglomeration.
[11] Besides the related census volumes, we also used the data contained in the population movement volume (KSH 1969) published by the Hungarian Central Statistical Office in 1969.
[12] Technically: we arrived to the individual communality values by taking the square of the component matrix values related to them.
[13] Only the community 'Érd' was capable of fighting its way from a municipality still entirely absent from urbanization in 1910, into the direct urbanization zone by 1941.