

Szilárd Hegedűs[1] - Csaba Lentner[2]: Analysis of the Competitiveness of the Hungarian Tax System in an International Environment[1] (Publico, 2022/4., 56-77. o.)
https://doi.org/10.32575/ppb.2022.4.4
Abstract
A composite indicator of tax competitiveness will be presented, which ranks Hungary among the moderately competitive OECD countries. It is compiled in such a way that corporate taxation and labour taxes pull the average upwards, and that an additional competitive advantage is the taxation of cross-border transactions. On the other hand, the significant tax administration burden, which worsens the value of the composite indicator, can be considered as a disadvantage. Hungary is in the worst position in terms of tax rates for consumption taxes. Overall, our tax competitiveness has improved by about 8 ranks from 2014 to 2021. We found that the Hungarian tax system is mostly characterised by a monetarist approach, but it also widely applies tax incentives, which is a characteristic of the Keynesian school. The evolution of tax revenues shows that sales taxes represent a significant share. Another feature of the Hungarian tax system is the significant reduction in taxes on labour, which is offset by increases in the personal income tax (PIT), which rises in line with income (solvent demand), and by increases in sales taxes resulting from the growth in consumption.
Keywords: tax systems, monetarist and fiscal economic schools, unorthodox method, Hungary, OECD countries
Absztrakt - A magyar adórendszer versenyképességének elemzése nemzetközi környezetben
Bemutatásra kerül egy az adóversenyképességet mérő kompozit mutató, amely alapján Magyarország az OECD országok körében a közepesen versenyképes országok közé tartozik. Ez úgy tevődik össze, hogy a vállalati adózás és a munkát terhelő adók felfelé húzzák az átlagot, sőt, további versenyelőnyünk a határon átnyúló ügyletek adóztatása. Ugyanakkor hátránynak tekinthető a jelentős adóadminisztrációs teher, amely rontja a kompozit mutató értékét. Magyarország helyzete - az adómértéket tekintve - a fogyasztási adók vonatkozásában a legrosszabb. Összességében értékelve: az adóversenyképességünk 2014-ről 2021-re mintegy 8 pozíciót javult. Megállapítottuk, hogy a magyar adórendszerre jobbára a monetarista felfogás jellemző, de széles körben alkalmazza az adókedvezményeket is, ami viszont a keynesi iskola jellemzője. Az adóbevételek alakulásában jól látható, hogy a forgalmi adók jelentős arányt képviselnek. A magyar adórendszer további jellemzője, hogy jelentősen csökkentek a munkát terhelő adók, amelyet egyrészt a jövedelemtömeggel (fizetőképes kereslettel) együtt emelkedő SZJA, másrészt a fogyasztás bővülésből adódó forgalom típusú adók növekményei kompenzálnak.
Kulcsszavak: tax systems, monetarist and fiscal economic schools, unorthodox method, Hungary, OECD countries
- 56/57 -
Economic aspects of taxation and a literature review related to tax competitiveness
The modern tax system was addressed by Adam Smith, one of the founding figures of economic thought, in his seminal work of 1776.[2] Smith believed in the self-regulating ability of the market and developed his system of criteria accordingly. According to his opinion, a good tax system takes into account the taxpayers' ability to pay and their ability to pay taxes and meets the conditions of predictability and transparency. The position of Fellegi and his colleagues[3] is that an important criterion for the tax system is that it can be fulfilled in a timely manner for the taxpayer, and that the collection costs from the side of the tax authorities should be low. And in times of crisis, it becomes of paramount importance that the volume of taxes should ensure as much as possible that the state's resources are covered.
Musgrave and his co-author[4] agreed with Smith's ideas in that the tax system should operate at a minimum cost, with the smallest deadweight loss. In their opinion, the stabilisation function is the one of the state economic functions that should be supported most by the creation of an appropriate tax environment. In his paper published in 2000 Stiglitz[5] agreed with Smith and Musgrave's cited studies, but added the condition of efficiency, flexibility, and the importance of political-social responsibility.
Among the schools of economics, we can distinguish several groups of views. For the purposes of our topic, we will highlight two of them: the monetarist view based on classical economic thought and the Keynesian doctrine. In chronological order, classical economic thinkers such as Smith in 1776 and Ricardo[6] in 1817 formulated theorems on the economic impact of taxes in their seminal works. According to their consistent opinion, the market is capable of self-regulation, hence a continuous budget is guaranteed. Based on this, Mill[7] argues that a properly designed tax system can therefore adapt to market conditions. However, the period of the Great Depression showed that the state must necessarily intervene when market conditions are no longer able to run the economy properly. Therefore, Keynes[8] argued that the state should intervene in the economy, and so he advocated an interventionist tax system. In the period following the oil boom of the 1970s, economic views were based on the idea of reducing market regulation, and thus on a deregulated tax system, especially the monetarist economic trend associated with Friedman.[9]
- 57/58 -
Table 1 Characteristics of taxes at different economics schools
| Keynesian school - intervener tax system | Monetarist school - self-regulating, deregulated tax system | |
| Income taxes | Progressive tax system, otherwise unfair to low-income earners | Reducing progressivity to avoid performance restraint |
| Tax benefits | Many tax benefits, in favour of state interventions | Reduction of benefits, normative tax system |
| Capital gains | Taxed on the same terms as wages | Reducing and eliminating taxes to support reinvestment |
| Sales taxes | Low rates, due to regressive effect | Preferred, consumption taxed at higher rates |
Source: Compiled by the authors based on Fellegi et al. 2022.
In our study we compare the views of the two schools of economics with those of the OECD countries, especially Hungary. According to the Keynesian school, it is important to operate progressive taxation, i.e. multi-rate income taxation. It considers that if marginal tax rates are low, this can be seen as unfair to lower earners. Hence, higher income tax rates were intended to achieve an income correction. Tax incentives can be a means of state intervention by which the state seeks to achieve the desired economic effect. Keynes considers it important that capital be taxed on the same terms as wages. Interventionist Keynesian tax theory advocates a tax system based on income and wealth taxes, with less use of consumption taxes.
The monetarist school of economics returned to classical economic views and believed in deregulation. It therefore argued for a normative tax system to facilitate tax administration. They proposed a relaxation of progressivity to promote performance and thus economic growth. Lower tax rates on capital gains are desirable, as they do not prevent the reinvestment of capital and the provision of resources to companies. Consumption taxes are preferable in the school's view, as their burden can be properly distributed among economic agents, which helps to reduce progressivity.
The proper functioning of the tax system determines the financial stability and resilience of a country or group of countries. Péter Halmai[10] examined the impact of taxation on economic resilience through an EU example. József Varga[11] analysed the effects of tax cuts as a means of whitening the economy. In his study, he highlighted tax reduction as a tool for economic whitening, and in addition to these, he emphasised the development of the tax authorities' information system and the improvement of tax morale as a tool for whitening the economy. László Nagy's[12] study among the Visegrád 4 countries found that there is no correlation between the competitiveness of tax regulation and capital
- 58/59 -
inflows, i.e. a country's tax system can be competitive even if taxes are higher, but he also reflected that competitiveness can be increased not primarily by simplifying tax rates but by simplifying tax regulation.
From our experience, we also see that demanding FDI does not primarily consider tax rates and the tax code itself before making decisions, but rather how stable the country is from a public finance point of view, how developed its work culture is, how skilled its workforce is and how modern its infrastructure is.
Economic analyses mainly emphasise the importance of an appropriate tax environment for the economy, while on the legal side, they see regularity and predictability as the cornerstone of trust. The latter has been investigated by Norbert Kis[13] and Zsuzsanna Hutkai with co-authors.[14] The coordination of legal and economic issues can be adequately assessed at the micro level by behavioural economics (based on Dobos - Takácsné György[15] and Gergely Deli et al.[16]), in this case we will examine the legal and economic aspects of the tax system together.
Material and methodology
For the OECD country studies, we were able to find comprehensive, audited data up to 2020. In our empirical analysis of tax systems at the international level, we have identified four main research objectives, as follows:
Table 2 The characteristics of taxes in different schools of economics
| Destination number | Time horizon | Purpose in brief | Examined variables/types of taxes |
| 1. | 2014, 2019, 2020 | The creation of a simple indicator system that can be measured in an international environment | STCI |
| 2. | 2014-2021 | Dynamic analysis of regulation in the Hungarian tax system | Corporate tax, general sales tax, social contribution tax, personal income tax, small business tax |
| 3. | 2014, 2019, 2020 | Income structure of the Hungarian budget | see Table 6 |
| 4. | 2014-2021 | International Taxation Index | Hungary's rankings and sub- indices |
Source: Compiled by the authors.
- 59/60 -
Objective 1: To measure the obscure and sophisticated nature of the tax system in an international context (complexity, variability of tax burden), an indicator of the time spent on tax rates and tax returns, called the "Simple Tax Composite Indicator" (STCI, short: composite indicator). Three categories (STCIct) were created based on the score derived from the composite indicator. The resulting categories were further analysed.
For the time interval, we considered the years 2014, 2019 and 2020.
The timeframes considered are 2014, 2019 and 2020. The years were chosen because 2014 was the first year of recovery from the 2007-2008[17] crisis, 2019 was the last year before the Covid pandemic, and 2020 was the first year with a pandemic and the last year for which audited data for all variables under study were available at the time of our analysis.
Objective 2: A regulatory dynamics analysis of the changes in the Hungarian tax system between 2014 and 2021, focusing on the changes in the tax legislation and their direction. In our analysis, we assess the changes in tax rates, the evolution of the tax wedge in a V4 comparison.
Objective 3: We have examined the revenue structure of the Hungarian budget in 2014, 2019 and 2020, aligned with the timeframe defined in the first objective, with the 2020 endpoint due to the availability of internationally audited data for that year.
Objective 4: The sub-indices and index of the International Competitiveness Index for Hungary, which is considered the international benchmark, are examined for the period 2014-2021 (based on Bunn-Asen[18]).
For our irst research objective, we used the following indicators, based on the database published by the OECD:
- Corporate tax rate (CTR t)
- Added value key (VR t)
- Maximum Income Tax Rate (TIR t)
- Corporate tax liability time expenditure (CorpTi t)
- Current sales tax time expenditure (ConTi t)
- Time expenditure on taxes on labour (LabTi t)
The composite indicator was calculated by dividing the six variables listed into three categories. The starting point was the OECD average value of each indicator. The value above the average was awarded 3 points, while if the value of the indicator was less than 50% of the OECD average, it was awarded 1 point, and the intermediate was awarded 2 points. Accordingly, 1 point is a low rating, 2 points a medium rating and 3 points a high rating. The STCI indicator is the sum of the scores for the six variables separately. The aim
- 60/61 -
of the indicator was to provide a simple and easy to calculate indicator system. The data obtained were analysed in an international and national context. The data source was the publicly available OECD database.[19]
The database published by the OECD does not include the normative, standard tax rates were the only ones available. Tax administration time is an estimate, here we have accepted the OECD estimate as accurate.
Sub-indicators and Values of the Simple Tax Composite Indicator (STCI) in OECD Member Countries (2014, 2019, 2020)
We begin the presentation of the own composite indicator with the descriptive statistical analysis, referring to the six sub-variables. In this respect, we examined the development of the six indicators in relation to three given years, that is, we examined 18 variables. In Table 2, we examined the level of tax rates using univariate statistical indicators. In Table 3, we examined the working hours spent on reporting each type of tax using simple statistical indicators.
With regard to the corporate tax rate, it can be stated that in 2014 the lowest value was in Switzerland (this country occupies the first place); however, the fact that cantons also levy different rates of tax on this tax base shades the picture. In 2014, Ireland had the second lowest tax rate at 12.5%, but the tax rate was low in Lithuania and Latvia, as well as in Canada. The highest corporate tax rate was applied in France and the USA, but the tax rate was high even in Columbia. In the first year of recovery from the crisis (2014), the average value in the examined countries was 25%, which is also the same as the median value (Table 3).
The average rate of corporate tax liability decreased by 24% in 2019, as did the minimum (9%) and maximum values (34%). The lowest tax rate this year was applied by Hungary, and the tax rate was also low in Ireland and Switzerland. Several countries with previously high tax rates (e.g. Belgium, the United States) have decided to reduce taxes. In the first year of the Covid pandemic (2020), Hungary also had the lowest corporate tax rate, followed by Chile, which adopted a significant tax cut, and then Ireland. This year, the highest corporate tax rates (32%) were in France and Columbia (Table 2).
In the case of corporate tax, the general trend in most countries has been towards tax cuts, especially in countries with higher tax rates than the OECD average.[20]
Furthermore, the average value added tax rate was 19% in all years examined, while the minimum rates increased slightly (from 5% to 7%). The lowest value added tax rates (7%)
- 61/62 -
were in Canada and Switzerland over the period, while the maximum rate was 27% in all years examined (Table 3).
For personal income tax, a distinction can be made between countries with progressive tax policies and countries with linear tax policies. The countries that applied a linear tax rate in 2014 were the Czech Republic, Estonia, Hungary, Latvia and Lithuania, i.e. mostly the EU member states that joined the European Union in 2004. The lowest rate was 15% for all the years under review for personal income tax rates. For the average, there was a slight increase until 2020, when the OECD average rose from 42% to 43%. Luxembourg had the most complex personal income tax system in 2014, with 19 tax rates, but Switzerland and Mexico also have 11 rates. There have been several changes to personal income tax rates for 2019, with Lithuania and Latvia, for example, phasing out single-rate taxation. Luxembourg, Mexico and Switzerland did not significantly change the number of personal income tax rates, while Luxembourg introduced a small tax cut, which remained unchanged in 2020. The highest marginal rates were applied by Austria and Belgium in 2014, with Austria leading the way in 2019 and 2020 (with a tax rate of 55%) (Table 3).
Table 3 Descriptive statistical analysis of the tax rate sub-indicators (N = 36)
| Variable | Corporate tax rate (CTR) | Value added key (VR) | Highest income tax rate (TIR) | ||||||
| 2014 | 2019 | 2020 | 2014 | 2019 | 2020 | 2014 | 2019 | 2020 | |
| Mean | 25% | 24% | 23% | 19% | 19% | 19% | 42% | 42% | 43% |
| Std. Deviation | 7% | 6% | 6% | 6% | 5% | 5% | 12% | 12% | 12% |
| Median | 25% | 25% | 23% | 20% | 21% | 21% | 46% | 46% | 46% |
| Minimum | 13% | 9% | 9% | 5% | 7% | 7% | 15% | 15% | 15% |
| Maximum | 38% | 34% | 32% | 27% | 27% | 27% | 50% | 55% | 55% |
Source: Compiled by the authors based on the OECD data (2022).
If we look at the amount of time (hours) spent on corporate tax administration, the trend points towards a decrease, especially in countries where the administrative demand for corporate tax liability was significant. The analysis of the data shows that the time spent on tax returns decreased significantly from 2014 to 2019 but stagnated or increased slightly in most countries in 2020, the obvious reason being the pandemic-induced increase in home office and the associated difficulties in accessing databases and communication interfaces (Table 4).
A similar process can be established about the time spent on sales tax declarations, where after the decrease in 2019, the time spent on declarations and administration increased slightly. Only taxes on labour show a decreasing trend in most countries in the three years under review, which indicates that the degree of digitisation is the highest for these types of taxes (Table 4).
- 62/63 -
It can also be stated that significantly more working hours were spent on declaring sales taxes than the time spent on labour taxes. And the least amount of time was spent, on average, on reporting the corporate tax liability (Table 4).
Table 4 Descriptive statistical analysis of the working time (hours) spent on reporting each type of tax (N = 36)
| Variable | Corporate tax liability time expenditure (CorpTi) | Current sales tax time expenditure (ConTi) | Time expenditure on taxes on labour (LabTi) | ||||||
| 2014 | 2019 | 2020 | 2014 | 2019 | 2020 | 2014 | 2019 | 2020 | |
| Mean | 46 | 43 | 43 | 70 | 67 | 66 | 58 | 54 | 55 |
| Std. Deviation | 29 | 25 | 26 | 39 | 36 | 36 | 32 | 29 | 34 |
| Median | 38 | 38 | 38 | 63 | 61 | 61 | 49 | 46 | 45 |
| Minimum | 10 | 5 | 5 | 14 | 14 | 14 | 8 | 8 | 8 |
| Maximum | 155 | 110 | 110 | 198 | 169 | 169 | 125 | 125 | 172 |
Source: Compiled by the authors based on OECD data (2022).
The STCI value is the sum of the point values calculated from the six variables described above, with a maximum value of 18 points. The value is considered favourable if it is as low as possible. A low STCI value occurs when the tax rate is lower than the average or when the number of man-hours required to prepare a particular return is lower than the average.
If we look at the ranking of countries based on the index, we see that Estonia's tax system has been the most competitive in each year, sharing the index with Switzerland in 2014 and leading the rest of the year. In second place each year was Norway, sharing the ranking with Switzerland in 2019 and the USA in 2020.
Table 5 Summary table of the STCI indicator and the resulting rankings for the three years under review
| STCI[14] | Rank[14] | STCI[19] | Rank[19] | STCI[20] | Rank[20] | |
| Australia | 13 | 3 | 13 | 4 | 13 | 4 |
| Austria | 16 | 6 | 17 | 8 | 16 | 7 |
| Belgium | 15 | 5 | 15 | 6 | 15 | 6 |
| Canada | 15 | 5 | 15 | 6 | 15 | 6 |
| Chile | 15 | 5 | 16 | 7 | 15 | 6 |
| Colombia | 16 | 6 | 17 | 8 | 17 | 8 |
| Czech Republic | 15 | 5 | 15 | 6 | 15 | 6 |
| Denmark | 13 | 3 | 13 | 4 | 13 | 4 |
| Estonia | 10 | 1 | 9 | 1 | 9 | 1 |
| Finland | 12 | 2 | 12 | 3 | 12 | 3 |
| France | 15 | 5 | 14 | 5 | 15 | 6 |
| Germany | 16 | 6 | 16 | 7 | 16 | 7 |
| Greece | 17 | 7 | 17 | 8 | 17 | 8 |
- 63/64 -
| STCI[14] | Rank[14] | STCI[19] | Rank[19] | STCI[20] | Rank[20] | |
| Hungary | 14 | 4 | 13 | 4 | 13 | 4 |
| Iceland | 13 | 3 | 14 | 5 | 14 | 5 |
| Ireland | 12 | 2 | 13 | 4 | 13 | 4 |
| Italy | 17 | 7 | 16 | 7 | 17 | 8 |
| Japan | 15 | 5 | 13 | 4 | 15 | 6 |
| Korea | 14 | 4 | 15 | 6 | 14 | 5 |
| Latvia | 13 | 3 | 15 | 6 | 14 | 5 |
| Lithuania | 14 | 4 | 14 | 5 | 15 | 6 |
| Luxembourg | 12 | 2 | 12 | 3 | 13 | 4 |
| Mexico | 13 | 3 | 13 | 4 | 12 | 3 |
| Netherlands | 15 | 5 | 14 | 5 | 14 | 5 |
| New Zealand | 13 | 3 | 15 | 6 | 15 | 6 |
| Norway | 12 | 2 | 11 | 2 | 11 | 2 |
| Poland | 15 | 5 | 15 | 6 | 14 | 5 |
| Portugal | 18 | 8 | 16 | 7 | 15 | 6 |
| Slovak Republic | 14 | 4 | 15 | 6 | 16 | 7 |
| Slovenia | 17 | 7 | 17 | 8 | 16 | 7 |
| Spain | 17 | 7 | 17 | 8 | 18 | 9 |
| Sweden | 15 | 5 | 15 | 6 | 14 | 5 |
| Switzerland | 10 | 1 | 11 | 2 | 12 | 3 |
| The Republic of Türkiye | 15 | 5 | 15 | 6 | 13 | 4 |
| The United Kingdom | 13 | 3 | 12 | 3 | 13 | 4 |
| The United States | 14 | 4 | 13 | 4 | 11 | 2 |
Source: Compiled by the authors based on own research (2022).
Hungary is ranked fourth in the index in each of the years under review, with a positive trend towards a decrease in the index value due to the reduction in the corporate tax rate, which has reduced the score. In our calculated system, the decrease in the score is a positive trend, but there has been no change in the other sub-areas (Table 5).
Case study of the Hungarian tax system between 2014-2021
In our regulatory dynamics analysis, we reviewed the relevant tax rules, in this case concluding the analysis in 2021 with a review of the completeness and the last closed domestic tax data.
The Hungarian tax system has undergone a major reform since 2010. One of its main features is the shift towards taxes on consumption and sales, as opposed to taxes on labour and corporate income. There have also been several changes and simplifications within the tax categories. As shown in the previous section, the Hungarian tax system is unique in that it has the lowest corporate tax rate among the OECD countries, while at the same time
- 64/65 -
it has the highest VAT rate of all the countries surveyed, placing it in the middle field of the STCI index, just missing the podium (4[th] place) every year.
To understand Hungary's tax competitiveness, let us look in more detail at the evolution of the tax rates for the main tax categories over the period 2014-2021.
In the EU Directive on Added Value,[21] VAT is a linear rate,[22] basically a single-rate tax, in addition to which two preferential tax rates can be applied. The tax rate according to the main rule did not change during the examined period (27%), however, the range of products and services included in the preferential rate was continuously expanded (Figure 1). In the period under review, basic foodstuffs (pork, poultry, milk, eggs, fish) were gradually transferred to the discount rate. To encourage investment and construction, the VAT on new apartments is included in the discounted rate, which lasts until the end of 2022. The Internet service, as well as the VAT rate for catering and commercial accommodation services, were also subject to a 5% rate. The 18% rate now includes only a limited range of products and services (bakery, certain dairy products, provision of music and dance events). There were therefore targeted tax reductions in the VAT during the examined period, which applied to basic foodstuffs and to services and products that have an impact on GDP growth.[23]
The social contribution tax rate (hereinafter referred to as: SZOCHÓ)[24] started to decrease from 2017 onwards (from 27% to 13% in 2021) (Figure 1), as compensation for the significant increase in the minimum wage and the guaranteed minimum wage, when a multi-year wage agreement was reached between employers, employees and the government. Under this plan, the government plans to reduce employment taxes to 11% over 6 years, in parallel with the phasing out of the vocational training levy in 2022. The aim is to simplify the tax burden on labour and to use the reduction in the tax burden to increase wages for companies and employers. Therefore, from 2017 to the end of 2020, the average gross salary increased from 290 thousand HUF to 403 thousand HUF, according to the KSH,[25] which is an increase of about 43%. In the SZOCHÓ, additional tax benefits are available to taxpayers if they employ disadvantaged groups due to their employment situation (people with an altered work capacity, career starters, people without professional qualifications) and if they carry out knowledge-intensive activities (researchers, R&D workers).
Regarding the personal income tax (PIT),[26] a change occurred in 2016, as the tax rate was reduced by one percentage point to 15% (Figure 1). The changes within the tax system have had a significant impact mainly on the tax base benefits. The first-married couples' allowance was introduced in 2015, to be claimed by newlyweds for 24 months as a tax base
- 65/66 -
allowance. The amount of the family tax base allowance has increased, in particular for those with two children, doubling from the previous allowance of HUF 66,670 per child to HUF 133,330 per child in 2019. A tax base allowance for mothers with four or more children was introduced in 2019, giving a 100% tax base allowance on a defined range of income included in the consolidated tax base. From 2021, the personal allowance for people with long-term illnesses became a tax base allowance,[27] which mainly gives those entitled to the family allowance a higher tax deduction possibility.[28] There are a number of simplifications for personal income tax returns. A draft tax return has been introduced, which represents a significant relief for taxpayers compared to previous returns, in particular for self-assessment. The draft tax return has also been extended to self-employed persons and farmers. In this way, the tax authorities have made life considerably easier for taxpayers. The draft return can be accepted and amended. In this way, the tax administration has taken a step towards a more service-oriented tax administration model.
The PIT, the SZOCHÓ and the social security contribution are closely related in the Hungarian tax system. In case of separately taxable income, with the entry into force of the SZOCHÓ Act, the upper limit of SZOCHÓ paid for each separately taxable income increased significantly to 24 times the minimum wage.[29] The scope of fringe benefits and tax-free benefits has been significantly narrowed from 2019, mainly for SZÉP cards, with a significant part of the former tax-free benefits being taxed as wages. It should be noted that the tax burden on SZÉP card benefits is steadily decreasing thanks to the reduction of the SZOCHÓ. The Social Security Act came into force in 2019, which unified the contributions previously paid under four headings at a rate of 18.5%. The change in the law is particularly beneficial for families with children, as previously they could not claim the family contribution credit from the labour market contribution. On the downside, however, the rate has not been reduced, and full social security contributions are deducted for those employed on a contract basis if their income reaches the insurance threshold.
The small business tax (hereinafter referred to as: KIVA) was included in the Hungarian tax system from 20 1 3.[30] Despite the initial resistance,[31] by 2021 there were already 65,000 KIVA taxpayers in Hungary. The reason for the popularity of the tax is the simplification in 2017 and the decreasing tax rate together with the SZOCHÓ. A major advantage of the tax is that it makes employment cheaper for companies engaged in labour-intensive activities. However, it is a disadvantage for companies involved in vocational training, as they cannot benefit from the related corporate tax relief. The small taxpayers itemized lump sum
- 66/67 -
tax (hereinafter referred to as: KATA), is present in this legislation. Due to the nature of non-tax itemized tax, the tax rate has not changed. Nevertheless, in 2021, the regulation of the tax code was tightened, which aims to sanction covert employment, even though the tax code already had such a restriction. The burden on domestic payers is indeed able to substantially increase the burden on those employing KATA contractors; however, the tightening of regulations has disadvantageous characteristics for KATA taxpayers who perform abroad, especially in relation to the export of knowledge-intensive services.[32] The KATA was recodified in 2022, significantly narrowing the scope of taxpayers and benefits.[33]
The corporate tax (hereinafter referred to as: TAO)[34] is perhaps one of the most competitive types of taxes in Hungary with a rate of 9% (unchanged since 2017) (Figure 1), which is the lowest among the OECD member countries, and in this respect the value of tax competitiveness in 2020 was the highest in Hungary. In addition to the corporate tax reduction, a number of measures sought to improve competitiveness. These include the abolition of the maximum of the SME tax base discount, as well as the increase and then the abolition of the upper limit of the SME tax relief.
Since 2019, the development tax credit has been continuously available with a lower threshold, but it requires significant administration. The development reserve is a special institution in the corporate tax code, which allows the accounting of investments not yet made as depreciation under the advance tax law. In this respect, the threshold has also been removed. Corporate tax encourages employment, investment, donations and research and development[35] in a prominent way. We consider the limitation of the use of energy efficiency tax benefits to be the only adverse change in the law.
- 67/68 -
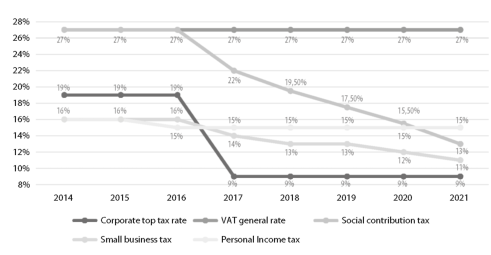
Figure 1 Evolution of the tax rates of the main tax types between 2014-2021
Source: Compiled by the authors based on own research of the tax laws (2022).
Note: Figure 1 shows the top rate for corporate tax and the standard rate for VAT.
An important competitiveness indicator is the tax wedge, which is calculated by subtracting the ratio of the net wage and the total wage cost from 1.[36] As you can see, the tax wedge without discounts is the highest in Hungary, but at the same time, a continuous decrease can be observed from 2014 onwards. From 2016, the decrease was caused by the reduction of the PIT rate, while from 2017 onwards, the reason for the decrease can clearly be traced back to the reduction of the SZOCHÓ. It can be seen that all V4 countries surveyed have a significantly higher value of the tax wedge without benefits, which represents a limited spending of income among those without children or already raising children.
If we are analysing it at an international level, the tax wedge in the Czech Republic rose during the period under review, but the pandemic interrupted the rise and brought it back below the Hungarian level. The lowest tax rate in the region is in Poland, which has a lower average than the OECD countries. The difference is striking in favour of the Czech Republic, Slovakia and Hungary compared to Poland (Figure 2). Besides the high VAT general rate, this is another major competitive disadvantage of the Hungarian tax system, as it taxes those not entitled to benefits more than the regional and EU average.
- 68/69 -
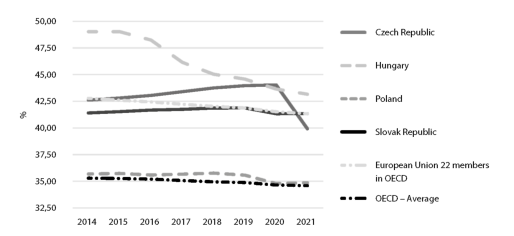
Figure 2 Evolution of the tax wedge without discounts in Hungary and the V4 countries
Source: Compiled by the authors based on OECD data (2022).
In another perspective, we also looked at the tax wedge for two-earner families with two children earning an average income. If we look at the Hungarian taxes, Hungary starts from the highest rate, like the individual tax rate without discounts, but from 2017 it manages to catch up with the regional average, ahead of Slovakia and, in some of the years under review, the Czech Republic, which implemented significant tax cuts following the pandemic. Also on the positive side, as of 2017, the Hungarian tax wedge is below the average of the OECD EU member states (Figure 3).
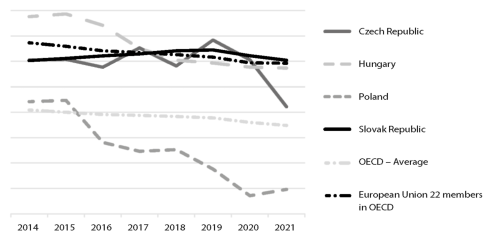
Figure 3 Tax wedge for two-earner families with two children in Hungary and the V4 Region
Source: Compiled by the authors based on OECD data (2022).
- 69/70 -
In summary, the Hungarian tax system manifests the reduction of the labour and income taxes and the increase in consumption taxes.
Revenue composition of the Hungarian budget in 2014, 2019, 2020
Statistical data on the revenue composition were available until 2020; for this section we have chosen 2014 as the opening year, due to Hungary's exemption from the excessive deficit procedure (quasi-consolidated status), 2019 being the last year before the pandemic and 2020 the last audited year.
Public law revenues can be classified into two groups: fiscal and other public law revenues (based on Kézdi et al.).[37] The first of these, the composition of tax revenue, is analysed. The first aspect that can be filtered is that tax revenues increased by 37.7% from 2014 to 2019, while the GDP expanded by 44.8% in nominal terms. In 2020, as a result of the pandemic, tax revenues fell, the reason for which could be the tax concessions and facilitations applied to stimulate the economy, on the other hand, the performance of the economy decreased during the period of closures.
It can be seen based on the data that the share of taxes on income and profit is below 20%, and the share of taxes on income and profit is considered stable in the budget. It can also be seen that the role of corporation tax in total revenue is steadily decreasing, while local business tax, although not included in this category, is the dominant tax on corporate activity. Social security contributions account for a third of total tax revenue, but the amount paid in this area is decreasing. This is due to a significant decrease in the SZOCHÓ rate, which was compensated by the PIT receipts due to wage growth, while social security contributions were still more paid by employers in 2014, and by individuals in 2019 and 2020 as a share of GDP. In the Hungarian tax system, the role of wealth taxes, which occur at the local level, is not significant. As you can see, the role of wealth taxes is negligible within the total tax revenues, as these are taxes related to financial transactions. In the domestic tax system, the role of consumption taxes is the most decisive, since almost half of the revenues are provided by these sources, with VAT accounting for a larger share, while excise taxes account for a smaller share. Here too, the share and hence the value of taxes has been steadily increasing, mainly due to the increasing efficiency of tax collection. Several tax administrative measures taken during the period (online cash register, EKAER, online invoicing) have significantly reduced the Hungarian VAT gap[38] (Table 5).
- 70/71 -
Table 6 Composition of tax revenues between 2014-2020 in Hungary
| Year | 2014 | 2019 | 2020 |
| Gross Domestic Product (billion HUF) | 32,815,207 | 47,530,610 | 48,276,363 |
| Total tax revenue (billion HUF) | 12,584,578 | 17,329,497 | 17,034,772 |
| Taxes on income, profits and capital gains | 17.74% | 17.72% | 17.65% |
| Personal income tax | 13.59% | 14.18% | 14.84% |
| Corporate income tax | 4.15% | 3.54% | 2.81% |
| Social security contributions | 33.06% | 32.00% | 30.98% |
| Employees | 13.18% | 15.99% | 16.69% |
| Employers | 19.69% | 15.84% | 14.29% |
| Taxes on payroll and workforce | 1.76% | 2.86% | 2.73% |
| Taxes on property | 3.32% | 2.58% | 2.98% |
| Building tax | 0.83% | 0.74% | 0.77% |
| Recurrent fees on immovable property | 1.52% | 1.28% | 1.32% |
| Recurrent fees on net wealth | 1.10% | 0.26% | 0.63% |
| Taxes on financial and capital transactions | 0.65% | 0.97% | 0.97% |
| Taxes on goods and services | 43.79% | 44.65% | 45.38% |
| Value added fees | 23.93% | 26.12% | 27.41% |
| Taxes on specific goods and services | 12.97% | 11.53% | 11.66% |
Source: Compiled by the authors based on OECD data and Bunn-Asen 2022
To summarise, the data show an increase in tax revenues and a shift towards consumption taxes in the revenue structure of the Hungarian budget.
Assessment of Tax Competitiveness in Hungary Based On Investigations by the Tax Foundation Between 2014-2021
Each year, the Washington-based Tax Foundation produces a tax competitiveness report for OECD member countries, the International Tax Competitiveness Index.[39] The report was completed for the OECD member countries between 2014 and 2021, so data for Hungary is also available for the period under review, and is summarised in Figure 4.
The index is also considered a composite indicator, as it determines the scores of the 5 sub-areas in a 100-point system. These sub-areas are: consumption taxes, corporate taxes, income taxes, wealth taxes and cross-border transactions. The sum of these scores gives the final score, which is also presented.
The analysis starts with the individual sub-indicators. Out of the list containing a total of 37 countries, Hungary achieved one of the worst rankings in terms of consumption taxes, as it
- 71/72 -
is in 36[th] place. The explanation for this lies in the VAT rate, which is considered a world record, and the complexity of the regulatory environment, according to the research institute. This can be explained by the world record VAT rate and the complexity of the regulatory environment. The latter factor is mainly due to the time taken to administer consumption taxes.
The score for the tax burden on companies has improved significantly, as Hungary has the lowest corporate tax rate and an investor-friendly attitude. In terms of wealth taxes, Hungary is in the middle of the ranking, mainly due to the asset value taxes on the banking sector, where the tax burden on the population is low.
In the future, "extra profit taxes" are likely to have a significant impact on the banking system, and a deterioration in this area is therefore predicted. Hungary's favourable position regarding the taxation of cross-border transactions is due to individual measures and subsidies that can be enforced within the tax system.[40] The taxation of income is in a relatively favourable range, with improved rankings, the reason for which is that the burden of taxes on capital is lower, and the Tax Foundation considers the single-rate PIT system to be favourable (Figure 4).
As a result, the Hungarian tax competitiveness index has been on a steadily improving trend since 2014, while the pandemic, the Russian-Ukrainian war and the management of fiscal imbalances are likely to lead to a stronger use of fiscal and tax policy tools, which we forecast to lead to a deterioration of the index value.
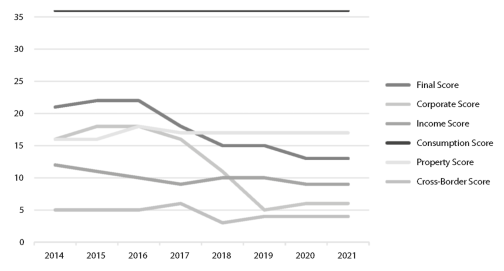
Figure 4 Rankings in the OECD Tax Foundation's tax competitiveness categories for Hungary
Source: Compiled by the authors based on Bunn-Asen 2022
- 72/73 -
If we look at the research institute's statistics for other countries, we see that for every year between 2018 and 2021, Estonia was the country with the most competitive tax system (as in the STCI indicator we use), followed by Latvia in second place for most of this period, and New Zealand in third place. Switzerland's tax system has also improved significantly over this period (although the STCI indicator shows the opposite), with Poland, France and Italy typically at the bottom of the list. The data show that the tax competitiveness of our country followed an improving trend until the outbreak of the epidemic crisis.
Conclusions
An important result of our research is the development of an indicator system measuring tax competitiveness, according to the criteria of which Hungary belongs to the competitive countries. Its competitive advantage is particularly evident in corporate taxation and labour taxes, but it is at a disadvantage due to the complexity of tax administration. According to the Tax Foundation, the most competitive area of the Hungarian tax system in 2021 was in the tax rules on cross-border transactions, followed by the rules on corporate taxation, which play a significant role due to international capital flows. Not surprisingly, Hungary ranks worst in consumption taxes. On the positive side, Hungary has improved its overall tax competitiveness by about 8 positions from 2014 to 2021.
Economic analysis and regulatory dynamics studies have shown that the Hungarian tax system favours elements of the monetarist conception, but cannot be considered a purely monetarist tax system, as it also applies tax allowances, which are a characteristic of the Keynesian school (Table 7). Several allowances have been incorporated into the tax elements that impose taxes on income and profits. Family benefits, marriage, maternity benefits of large families, young people and people with long-term illnesses receive substantial benefits in the form of tax base relief through the tax system.
Table 7 Characteristics of the Hungarian tax system according to the perception of economic schools
| Keynesian school | Monetarist school | |
| Income taxes | ||
| Tax benefits | ||
| Capital gains | ||
| Sales taxes |
Source: Compiled by the authors based on own research (2022).
Hungarian corporate taxes show a strong support for SMEs, both in terms of taxes and tax base benefits. These traits follow the characteristics of the Keynesian school. Capital
- 73/74 -
income is taxed at a lower rate than wages,[41] especially if the taxpayer is not entitled to any benefits.
The preference for sales taxes is reflected in the evolution of tax revenues, which increased both in share and nominal value compared to 2014. The preference for consumption taxes is reflected in the significantly high VAT rate of 27%, which is also significantly high at world level. Another sign in this direction is the development of a tax system that encourages work, in particular employment, which has significantly reduced the size and share of labour taxes in tax revenues, which can be compensated by the increase in the personal income tax resulting from the increase in incomes.
The revenue composition also reflects the preference for a monetarist approach, given that sales tax revenues are the most important, with a significant reduction in VAT evasion. The next few years will show to what extent the Hungarian tax system built up since the 2010s can be maintained, with sales and consumption taxes playing a key role. A similar trend can also be observed for crisis taxes, so it is likely that these taxes will also be responsible for restoring budgetary balance.
Based on our survey of the OECD countries, we found that even if the level of taxes is high, but if the investors see the operation of the country safe, that is, if they receive adequate infrastructure and a macroeconomic environment, then they consider the given country to be competitive. Moreover, not only the time spent on tax administration but also the tax rates are a major determinant of a country's tax competitiveness, and in particular the low degree of change in tax rules, i.e. predictability, is a positive factor.
Our analysis shows that in the OECD countries, corporate taxes decreased between 2014 and 2019, income taxes tended to increase among the countries making tax changes, while consumption taxes and value added taxes showed a clear upward trend. The explanation for this phenomenon is that countries are trying to encourage investment through favourable corporate tax rates and, to a lesser extent, reduced administration. The impact of the pandemic, since it occurred in the middle of the year (2020) in most OECD countries, has not yet triggered tax policy changes, and it is likely that the full impact of the pandemic will be felt in the years to come.
- 74/75 -
References
1. Bunn, Daniel - Asen, Elke (2022): International Tax Competitiveness Index 2021. Washington, D.C.: Tax Foundation.
2. Csath, Magdolna (2019): Middle-Income Trap or Development Trap and its Budgetary Effects. Public Finance Quarterly, 64(1), 30-50.
3. Czeczeli, Vivien - Kolozsi, Pál Péter - Kutasi, Gábor - Marton, Ádám (2021): Short-Term Impact of Covid-19 in the Clusters of EU Market Economies. In Lovrinović, Ivan - Vidaković, Neven (eds.): Macroeconomic Responses to the Covid-19 Pandemic. Policies from Southeast Europe. Cham: Palgrave Macmillan. 53-84. Online: https://doi.org/10.1007/978-3-030-75444-0_3
4. Dobos, Piroska - Takácsné György, Katalin (2020): Az adózók magatartását vizsgáló elméleti modellek ellentmondásai [Contradictions of the Theoretical Models Examining the Taxpayer's Behaviour]. Pro Publico Bono - Public Administration, 8(4), 36-49. Online: https://doi.org/10.32575/ppb.2020.4.4
5. Deli, Gergely - Kemény, Gábor - Tóth, József (2020): Bevezetés a jog viselkedési közgazdaságtani elemzésébe [Introduction to Behavioural Economics of Law]. Budapest: Alapjogokért Központ.
6. Fellegi, Miklós - Burján, Ákos - Galántainé Máté, Zsuzsanna - Kovácsné Sipos, Ágnes (2022): Adóismeretek [Taxation]. Budapest: Saldo.
7. Friedman, Milton (1980): Free to Choose. A Personal Statement. New York: Harcourt Brace.
8. Halmai, Péter (2021): Resilience in Focus. Certain Mechanisms of the Deepening of the Economic and Monetary Union. Public Finance Quarterly, 66(1), 7-31. Online: https://doi.org/10.35551/PFQ_2021_1_1
9. Hutkai, Zsuzsanna - Jobbágy, Zoltán - Kis, Norbert - Mészáros, Bence - Téglási, András (2019): Biztonság és bizalom a kormányzatban [Security and Trust in the Government]. In Kaiser, Tamás (ed.): A jó állam mérhetősége III. Budapest: Dialóg Campus. 9-29.
10. Keynes, John (1936): The General Theory of Employment, Interest and Money. Macmillan Cambridge University Press for the Royal Economic Society.
11. Kézdi, Árpád - Nyikos, Györgyi - Kokas, Barbara - Csányi, Réka (2018): Államháztartás [State Management]. Budapest: Dialóg Campus.
12. Kis, Norbert (2019): A kormányzás értéktani kérdései [Values in Governance]. In Kaiser, Tamás (ed.): A modern kormányzás koncepcionális és közpolitikai keretei. Hazai és nemzetközi dimenziók [Conceptual and Public Policy Frameworks of Modern Governance. Domestic and International Dimensions]. Budapest: Dialóg Campus. 209-223.
13. Kis, Norbert (2018): The Role and Impact of Trust on the Operation and Sustainability of the State. Public Finance Quarterly, 63(3), 299-311.
14. MiLL, John Stuart (2015): Principles of Political Economy. Some Good Press Kindle Edition.
- 75/76 -
15. Musgrave, Peggy B. - Musgrave, Richard A. (1989): Public Finance in Theory and Practice. New York: McGraw-Hill.
16. Nagy, László (2017): Impact of the Tax System on the Competitiveness of Businesses and Capital Inflow. International Comparison Within the CEE Region. Public Finance Quarterly, 62(1), 21-36.
17. Nyikos, Györgyi - Laposa, Tamás - Béres, Attila (2020): Micro-Economic Effects of Public Funds on Enterprises in Hungary. Regional Studies, Regional Science, 7(1), 346361. Online: https://doi.org/10.1080/21681376.2020.1805351
18. Ricardo, David (2001) [1817]: On the Principles of Political Economy and Taxation. Kitchener: Batoche Books.
19. Smith, Adam (2007) [1776]: An Inquiry into the Nature and Causes of the Wealth of Nations. Edited by Sálvio Marcelo Soares. Meta Libri Digital.
20. Stiglitz, E. Joseph (2000): Economics of the Public Sector. New York: W.W. Norton & Company.
21. Varga, József (2017): Reducing the Tax Burden and Whitening the Economy in Hungary after 2010. Public Finance Quarterly, 62(1), 7-21.
Legal references
1. Council Directive 2006/112/EC of 28 November 2006
2. Act LII of 2018 on Social Contribution Tax
3. Act CXLVII of 2012 on the Itemized Tax of Low-Tax Enterprises and the Small Business Tax
4. Act CXXVII of 2007 on General Sales Tax
5. Act LXXXI of 1996 on Corporate Tax and Dividend Tax
6. Act CXVII of 1995 on Personal Income Tax
- 76/77 -
Szilárd Hegedűs was admitted to Szent István University (today: Hungarian University of Agrarian and Life Sciences) in 2005, where he completed his studies in 2010 as a certified agricultural engineer-economist (majoring in regional development and finance and accounting) and a certified engineering teacher. In 2010, he obtained a professional qualification as a certified accountant and in 2014 as a tax consultant. From 2010, he completed his doctoral studies at the Doctoral School of Economics and Organizational Sciences of Szent István University. In 2016, he obtained a doctorate (PhD) degree. Since 2016, he has been working at the Faculty of Finance and Accounting of the Budapest University of Economics, and as an associate professor from 2021. Since 2017, he has been a researcher of the University of Public Service in various positions. Recently his work connets to Széll Kálmán Public Finance Lab. His research topics are public finance, fiscal policy, asset management and taxation.
Csaba Lentner is a full professor at University of Public Service, senior lecturer of the Department of Governance and Public Policy. Dr. Lentner is head of the Széll Kálmán Public Finance Research Lab at the University of Public Service. On a secondary position he is head of department at the Károli Gáspár University of the Reformed Church in Hungary, Faculty of Law. in Faculty of Law. He graduated the Budapest University of Economics (nowdays Corvinus University, Budapest) in 1989, and then obtained a university doctorate. In 1995, he was appointed candidate of economic sciences in the Hungarian Academy of Sciences. In 2003, he obtained his habilitation on public finance field. He passed the professional exam of tax expert and chartered accountant (CPA). He is vice chairman of Pallas Athéné Domus Meriti Foundation, established by Hungarian National Bank. Professor Lentner awarded by Wekerle Sándor Scientific Lifetime Award (2013), then the Hungarian Order of Merit Officer's Cross (2018) and the Magyary Zoltán Memorial Medal (2021). ■
NOTES
[1] Made in the Széll Kálmán Public Finance Lab at the University of Public Service, Budapest.
[2] Smith 2007 [1776].
[3] Fellegi et al. 2022.
[4] Musgrave-Musgrave 1989.
[5] Stiglitz 2000.
[6] Ricardo (2001) [1817].
[7] Mill 2015.
[8] Keynes 1936.
[9] Friedman 1980: 6-7.
[10] Halmai 2021: 7-31.
[11] Varga 2017: 7-21.
[12] Nagy 2017: 21-36.
[13] Kis 2019: 209-223; Kis 2018: 299-311.
[14] Hutkai et al. 2019: 9-29.
[15] Dobos - Takácsné György 2020: 36-49.
[16] Deli et al. 2020.
[17] In relation to Hungary, this was the first full year when the country came out of the EU's excessive deficit procedure, and the OECD countries also comprehensively consolidated their economies by 2014.
[18] Bunn-Asen 2022.
[19] For more information see https://stats.oecd.org/
[20] A possible explanation for this is that individual EU member states supported the stimulation of consumption and capital formation with tax cuts (see Czeczeli et al. 2021: 53-84).
[21] Council Directive 2006/112/EC of 28 November 2006.
[22] Act CXXVII of 2007 on General Sales Tax.
[23] EU developments generate considerable VAT revenue, so they have a strong budgetary impact (see Nyikos et al. 2020: 346-361).
[24] Act LII of 2018 on Social Contribution Tax.
[25] KSH - Hungarian Central Statistical Office (www.ksh.hu/docs/hun/xstadat/xstadat_evkozi/e_qli029b.html).
[26] Act CXVII of 1995 on Personal Income Tax.
[27] It used to be a tax benefit, calculated at 5% of the minimum wage.
[28] In 2022, the tax base allowance for under-25s was introduced, providing a tax base allowance for young people up to their average income in the previous year.
[29] The reaction to changes in the economy can be observed in case of separately taxable income. One of these is the regulation on cryptocurrencies, which will be renewed in 2022, as well as the entrepreneur-friendly modification of general taxation, with the introduction of a tax-free income amount and its value stability due to its binding to the minimum wage.
[30] Act CXLVII of 2012 on the Itemized Tax of Low-Tax Enterprises and the Small Business Tax.
[31] It was mainly experienced by accountants.
[32] Outside of the examination time horizon, in the current tax year (from 1 September 2022), the KATA taxation has undergone a significant transformation, which means a significant reduction for taxpayers. Our analysis did not cover the system of local taxes either, where significant changes were also made from 2020 to the detriment of local governments as tax authorities and to the advantage of businesses.
[33] The law was amended a few weeks ago, so it has not yet been scientifically and thoroughly evaluated. However, it will be a priority area for research at the Széll Kálmán Public Finance Lab.
[34] Act LXXXI of 1996 on Corporate Tax and Dividend Tax. It is interesting that the dividend tax included in the name of the law has been subject to the PIT since 2005.
[35] The common feature of the latter is that, under certain conditions, a 3x tax base discount can be applied.
[36] Tax wedge formula: [1 - (Net wage / Total wage cost)].
[37] Kézdi et al. 2018.
[38] A value of 22% in 2013 to 9.6% in 2019 (https://ec.europa.eu/commission/presscorner/detail/en/ip_21_6466).
[39] Bunn-Asen 2022.
[40] Magdolna Csath drew attention to the dangers of this, as she believes that transfer pricing can result in companies underperforming their actual performance (see Csath 2019: 30-50).
[41] Due to the upper limit of the SZOCHÓ, with regard to the taxation of dividends and exchange rate gains, even without the upper limit, a total of 28% is taxed, while income from wages is taxed at a total of 41.15%.
Lábjegyzetek:
[1] The author is Associate Professor, Budapest Business School; researcher, Széll Kálmán Public Finance Lab, University of Public Service, Faculty of Public Governance and International Studies, hegedus.szilard@uni-bge.hu.
[2] The author is Full Professor, Head of the Széll Kálmán Public Finance Lab, University of Public Service, Faculty of Public Governance and International Studies, Lentner.Csaba@uni-nke.hu.