Katalin Nagy Kovacsics[1]: Ranking of the Cities Recognized between 1983 and 1995 by their Grade of Development (Annales, 2005., 181-203. o.)
The measurement of the development of settlements and the urbanisation level of cities is an old and recurring problem of city-statistics and urban studies. Which criteria define the urbanisation level of cities? Are our cities urbanised? The former question is answered by professional literature in several ways. The concept of the city is defined in different ways in the different countries. In Hungary settlements with a legal status - i.e. settlements that are declared to be cities by provision of law - are called cities. Naturally there are differences in degree among these cities too, since there are cities in the administrative sense, but showing only a low level of urbanisation as regards their grade of development.
Urban development is defined by the role a settlement plays in its surroundings, the tasks it fulfils, the fairly large number of population, the high density of its downtown population, the high rate of urban professions (industry, trade, transportation, services), the large number of high-rise apartment-blocks, the local transport, the amount of artificial surroundings, the improved level of public utilities, the number of social and cultural institutions and the degree of supply of the population.
The examination of the development level of cities has been made a topic by the fact that during the past two decades - following the disappearance of districts - the number of cities has suddenly increased. At the turn of the 20[th] century there were merely 14 cities on the territory of the present-day Hungary, and during the following fifty years only ten more settlements were officially ranked as cities. After 1950 the number of cities grew faster due to the increased speed of industrialization, at the time of the 1960 census there were already 62 cities, including Budapest. In the sixties this process slowed down, only seven settlements were given the legal status of a city, while in the seventies there was another wave, when again a lot of settlements were officially ranked as cities. In 1973 there were 83 cities, in 1978 this number was 96, in 1989 40 settlements got the legal status of a city, in 1990 the number of cities was 148, in 1995 it was 200, in 2003 it was 252.
- 181/182 -
With this dramatic increase in the number of cities the question emerges whether these new cities are urbanized, and if yes, to what extent. To answer this question I have examined cities that have been given the legal status of a city between 1983 and 1995, altogether 104 of them. Out of these 27 settlements were given the legal status of a city between 1983 and 1986, 40 of them in 1989, 30 between 1990 and 1993 and 6 in 1995. 68 of these new cities are in Bács-Kiskun, Békés, Hajdú-Bihar, Jász-Nagykun-Szolnok, Pest, Somogy and Szabolcs-Szatmár-Bereg counties, 33 are in Csongrád, Fejér, Heves, Komárom-Esztergom, Nógrád, Tolna, Vas, Veszprém and Zala counties and only 3 are in Baranya and Győr-Moson-Sopron counties.
The comparison of every-day statistics has been made so far by intensity ratios, most suitable for the investigation of the degree of supply. The existing indexes, however, give only in a single respect a base of comparison. As the development of cities is influenced by a great number of factors, different and independent from one another, intensity ratios cannot be suitable for their investigation. They would result in as many different ranking lists as intensity ratios. It is by no means sure that a city, which regarding public utilities has the first place tops the list in sanitation or cultural development as well. Intensity ratios are also unsuitable for the analysis of the conditions of a single city, without comparison to others, should the goal be to find the fields with deficiencies and those, where the supply of the city is satisfactory, since each intensity ratio is expressed by a different unit of measurement.
These unsolved problems directed the attention of specialists to the development of a complex method that would make possible the ranking of the cities based on objective criteria. As my method of examination I used the complex index for regional grade of development, which I developed in 1963 and which - since then - has been presented by me on international forums (IUSSP, IARUS) and has also been used several times by CSO (Central Statistical Office) when creating the ranking order of regions. Foreign and Hungarian authors are unanimous in stating that the determination of the character and of the grade of development of a city is composed of two steps:
a) A decision should be taken regarding the selection of the factors that determine the character and the grade of development of a city
b) Then on the basis of numerical values resulting from the selected factors a complex index should be developed.
- 182/183 -
To examine the grade of development and the degree of supply of cities I used as sources the following intensity ratios:
Dwellings per 100 inhabitants
Number of public lighting spots per 1 km length of downtown public roads
Length of piped gas per 1 km of downtown public roads
Length of public water-conduit per 1 km of downtown public roads
Length of public sewage network per 1 km of downtown public roads
Number of hospital beds per 1000 inhabitants
Number of classrooms per 100 secondary school students
Number of enterprises per 1000 inhabitants
Number of catering outlets per 10000 inhabitants
Proportion of commuters compared to the total population
Number of non-agricultural wage-earners compared to the total number of wage-earners
Undoubtedly, a lot more indices would have been necessary for the measurement of urbanisation, but these were either not available (number of high-rise apartment blocks, data of local transportation), or - while being amply available (like eg. the data of public health, or cultural supply) - processing them would have exceeded the limits of this modest study. In this study I took as a starting point the calculation of the above-mentioned index figures of the selected cities (Table no.1). On the basis of these index figures I defined the "average city" created from the data of the cities selected for the study. This is a hypothetical city, each index figure of which is a weighted mathematical average of the index figures of intensity belonging to the cities subject to the study. During the weighting process the number of population, the length of downtown public roads, the number of secondary school students and the number of wage earners were regarded as the weight. The parameters of the "average city" created this way are presented in the last line of Table no. 1.
- 183/184 -
Table no.1.
Intensity ratios of the 104 cities[1*]
| Name of the city | Year | Dwellings per 100 citizens | Number of public lighting spots | Length of piped gas | Length of public water conduit | Length of public sewage network | Number of hospital beds per 1000 citizens | Number of classrooms per 100 secondary school students | Number of enterprises per 1000 citizens | Number of catering outlets per 10000 citizens | Proportion of commuters compared to total population | Proportion of non- agricultural wage- earners compared to total number of wage- earners |
| per 1 km downtown public roads | ||||||||||||
| Abony | 1993 | 38,3 | 18,0 | 1,2 | 0,9 | 0,4 | 0,0 | 7,5 | 41,4 | 31,5 | 1,3 | 80,6 |
| Aszód | 1991 | 36,6 | 16,7 | 1,2 | 1,0 | 0,3 | 0,0 | 4,6 | 57,4 | 70,8 | 17,2 | 93,8 |
| Bácsalmás | 1986 | 44,2 | 14,6 | 1,7 | 0,7 | 0,1 | 0,0 | 3,6 | 47,3 | 21,3 | 11,5 | 61,8 |
| Baktalórántháza | 1993 | 32,3 | 14,8 | 1,7 | 1,0 | 0,3 | 0,0 | 2,8 | 40,4 | 66,4 | 28,5 | 81,9 |
| Balatonalmádi | 1989 | 44,7 | 15,6 | 0,5 | 0,6 | 0,4 | 0,0 | 3,2 | 104,9 | 76,8 | 10,8 | 96,6 |
| Balatonboglár | 1991 | 43,0 | 21,8 | 1,2 | 0,6 | 0,5 | 0,0 | 5,4 | 102,6 | 91,7 | 0,0 | 74,7 |
| Balatonföldvár | 1992 | 45,8 | 31,7 | 0,9 | 1,3 | 1,2 | 0,0 | 0,0 | 130,3 | 583,6 | 38,4 | 92,5 |
| Balatonlelle | 1991 | 42,6 | 26,8 | 0,7 | 1,1 | 0,9 | 0,0 | 0,0 | 107,2 | 375,0 | 39,8 | 74,7 |
| Balmazújváros | 1989 | 34,2 | 17,4 | 1,5 | 1,3 | 0,3 | 0,0 | 4,2 | 41,3 | 50,4 | 1,3 | 62,1 |
| Bátaszék | 1995 | 36,6 | 20,5 | 1,6 | 1,1 | 0,3 | 0,0 | 4,3 | 59,4 | 46,2 | 13,0 | 82,0 |
| Bátonyterenye | 1989 | 40,1 | 19,1 | 0,8 | 1,1 | 0,4 | 0,0 | 2,5 | 41,5 | 31,2 | 15,4 | 94,3 |
| Battonya | 1989 | 48,9 | 12,3 | 0,9 | 0,7 | 0,1 | 0,0 | 3,7 | 32,8 | 55,6 | 2,2 | 69,5 |
| Bicske | 1986 | 35,4 | 18,9 | 0,4 | 1,3 | 0,5 | 0,0 | 4,5 | 52,5 | 51,5 | 17,7 | 89,9 |
| Biharkeresztes | 1989 | 38,7 | 21,6 | 1,4 | 0,8 | 0,1 | 0,0 | 3,1 | 46,3 | 46,7 | 17,3 | 81,9 |
[1] Sources: Területi statisztikai Évkönyv, KSH (Regional Statistical Yearbook),
1996. CSO. Budapest, 1998. 1990. évi Népszámlálás Megyei kötetei (County volumes of the 1990 Census)
1990. évi Népszámlálás, Az aktív keresők munkahelye és lakóhelye. (1990 Census, Places of work and dwelling-places of active wage-earners)
- 184/185 -
| Name of the city | Year | Dwellings per 100 citizens | Number of public lighting spots | Length of piped gas | Length of public water conduit | Length of public sewage network | Number of hospital beds per 1000 citizens | Number of classrooms per 100 secondary school students | Number of enterprises per 1000 citizens | Number of catering outlets per 10000 citizens | Proportion of commuters compared to total population | Proportion of non- agricultural wage- earners compared to total number of wage- earners |
| per 1 km downtown public roads | ||||||||||||
| Budaörs | 1986 | 37,0 | 22,8 | 1,5 | 0,9 | 1,0 | 0,0 | 3,5 | 126,5 | 57,7 | 28,2 | 90,8 |
| Csenger | 1989 | 36,5 | 18,8 | 1,6 | 0,7 | 0,1 | 0,0 | 3,4 | 52,6 | 44,3 | 9,1 | 72,1 |
| Csepreg | 1995 | 36,4 | 25,4 | 1,4 | 0,9 | 0,5 | 0,0 | 3,0 | 63,9 | 41,2 | 7,5 | 67,8 |
| Csurgó | 1989 | 36,5 | 12,3 | 0,5 | 0,4 | 0,1 | 0,0 | 4,4 | 61,2 | 46,2 | 15,3 | 71,6 |
| Dabas | 1989 | 36,8 | 15,2 | 1,3 | 0,7 | 0,1 | 0,0 | 4,1 | 78,4 | 51,0 | 8,9 | 70,0 |
| Derecske | 1991 | 35,6 | 16,4 | 1,1 | 0,8 | 0,1 | 0,0 | 3,3 | 66,3 | 31,9 | 3,1 | 77,8 |
| Dorog | 1984 | 23,7 | 25,2 | 1,0 | 2,0 | 0,8 | 3,7 | 4,2 | 37,2 | 36,4 | 26,6 | 98,1 |
| Dunaföldvár | 1989 | 28,8 | 16,6 | 1,2 | 0,7 | 0,2 | 0,0 | 4,4 | 41,9 | 43,7 | 2,8 | 81,0 |
| Edelény | 1986 | 32,4 | 14,9 | 1,2 | 1,0 | 0,4 | 21,0 | 5,5 | 40,7 | 38,3 | 9,7 | 84,3 |
| Encs | 1984 | 32,5 | 16,7 | 0,0 | 0,9 | 0,5 | 0,0 | 4,5 | 54,0 | 71,3 | 18,9 | 87,9 |
| Enying | 1992 | 34,5 | 12,9 | 1,4 | 0,8 | 0,0 | 0,0 | 3,1 | 48,1 | 43,8 | 5,2 | 65,2 |
| Fertőd | 1995 | 31,9 | 9,1 | 0,8 | 0,7 | 0,1 | 0,0 | 4,3 | 76,0 | 87,7 | 24,1 | 65,9 |
| Fonyód | 1989 | 40,4 | 23,2 | 0,6 | 1,1 | 0,3 | 0,0 | 3,5 | 118,2 | 522,8 | 31,4 | 82,1 |
| Füzesabony | 1989 | 37,4 | 21,5 | 1,4 | 1,1 | 0,2 | 0,0 | 3,0 | 55,2 | 43,8 | 23,2 | 88,0 |
| Gárdony | 1989 | 37,8 | 18,6 | 1,2 | 1,1 | 0,5 | 0,0 | 0,0 | 72,8 | 300,9 | 11,2 | 71,1 |
| Gyomaendrőd | 1989 | 41,3 | 6,5 | 0,5 | 0,4 | 0,1 | 1,4 | 3,9 | 57,8 | 52,3 | 3,5 | 70,8 |
| Hajdúdorog | 1989 | 39,9 | 17,0 | 1,3 | 1,0 | 0,2 | 0,0 | 4,3 | 43,0 | 43,6 | 1,0 | 71,4 |
| Hajdúhadház | 1991 | 32,2 | 23,7 | 1,4 | 1,0 | 0,0 | 0,0 | 4,5 | 24,6 | 21,2 | 14,2 | 73,9 |
| Heves | 1984 | 36,3 | 22,5 | 1,4 | 1,1 | 0,6 | 0,0 | 3,3 | 50,1 | 48,9 | 8,8 | 81,4 |
| Héviz | 1992 | 45,9 | 24,7 | 1,4 | 0,9 | 0,4 | 123,0 | 4,9 | 147,4 | 358,8 | 48,8 | 93,2 |
| Ibrány | 1993 | 33,4 | 12,7 | 1,0 | 0,9 | 0,5 | 0,0 | 3,4 | 39,8 | 40,1 | 2,2 | 82,6 |
| Jánoshalma | 1989 | 43,4 | 12,9 | 1,3 | 0,8 | 0,1 | 0,0 | 4,7 | 51,5 | 34,4 | 2,6 | 58,5 |
- 185/186 -
| Name of the city | Year | Dwellings per 100 citizens | Number of public lighting spots | Length of piped gas | Length of public water conduit | Length of public sewage network | Number of hospital beds per 1000 citizens | Number of classrooms per 100 secondary school students | Number of enterprises per 1000 citizens | Number of catering outlets per 10000 citizens | Proportion of commuters compared to total population | Proportion of non- agricultural wage- earners compared to total number of wage- earners |
| per 1 km downtown public roads | ||||||||||||
| Jászapáti | 1989 | 38,8 | 23,9 | 1,3 | 1,1 | 0,1 | 0,0 | 2,8 | 39,5 | 53,8 | 4,1 | 76,6 |
| Jászárokszállás | 1991 | 44,9 | 10,6 | 0,8 | 0,8 | 0,2 | 0,0 | 6,2 | 49,1 | 47,8 | 3,0 | 77,9 |
| Jászfényszaru | 1993 | 45,0 | 25,2 | 1,1 | 1,0 | 0,0 | 0,0 | 0,0 | 36,2 | 33,1 | 6,8 | 78,7 |
| Kecel | 1993 | 43,1 | 22,5 | 1,5 | 1,0 | 0,0 | 0,0 | 0,0 | 53,2 | 40,8 | 2,4 | 43,8 |
| Kisbér | 1986 | 36,9 | 14,7 | 1,8 | 1,6 | 0,1 | 15,8 | 5,4 | 59,5 | 39,1 | 14,7 | 78,5 |
| Kiskunmajsa | 1989 | 41,3 | 21,4 | 1,4 | 1,0 | 0,1 | 0,0 | 3,9 | 58,9 | 85,2 | 4,4 | 61,6 |
| Kistelek | 1989 | 44,2 | 12,6 | 1,7 | 0,9 | 0,2 | 0,0 | 3,5 | 62,4 | 49,1 | 7,8 | 78,9 |
| Kunhegyes | 1989 | 38,9 | 16,9 | 1,3 | 1,1 | 0,2 | 2,3 | 3,5 | 46,0 | 53,4 | 7,2 | 72,5 |
| Kunszentmárton | 1986 | 41,5 | 20,4 | 0,8 | 0,9 | 0,3 | 0,0 | 2,7 | 49,5 | 51,3 | 8,1 | 77,6 |
| Kunszentmiklós | 1989 | 39,3 | 13,2 | 1,1 | 0,8 | 0,1 | 0,0 | 5,2 | 50,7 | 33,9 | 5,8 | 82,4 |
| Lajosmizse | 1993 | 40,8 | 22,2 | 1,4 | 0,8 | 0,2 | 0,0 | 0,0 | 67,9 | 53,3 | 5,7 | 60,9 |
| Lengyeltóti | 1992 | 34,4 | 22,9 | 1,1 | 1,1 | 0,0 | 0,0 | 0,0 | 53,9 | 35,3 | 11,4 | 67,3 |
| Letenye | 1989 | 32,1 | 20,0 | 1,4 | 1,1 | 1,0 | 0,0 | 0,0 | 53,5 | 69,1 | 12,7 | 83,5 |
| Lőrinci | 1992 | 39,7 | 15,6 | 1,3 | 1,4 | 0,2 | 0,0 | 0,0 | 33,8 | 46,9 | 18,9 | 94,3 |
| Máriapócs | 1993 | 31,0 | 15,8 | 1,1 | 0,8 | 0,0 | 0,0 | 0,0 | 37,2 | 55,0 | 22,5 | 57,4 |
| Martfű | 1989 | 35,9 | 25,9 | 1,3 | 1,4 | 1,4 | 0,0 | 3,2 | 48,5 | 32,3 | 35,6 | 91,4 |
| Mezőberény | 1989 | 39,4 | 20,6 | 1,3 | 1,1 | 0,3 | 0,0 | 3,5 | 47,3 | 34,0 | 3,2 | 79,5 |
| Mezőcsát | 1991 | 37,3 | 15,8 | 2,3 | 1,0 | 0,1 | 0,0 | 4,5 | 44,5 | 43,9 | 3,8 | 73,4 |
| Mezőhegyes | 1989 | 45,5 | 34,3 | 2,2 | 1,5 | 0,3 | 11,7 | 3,6 | 34,8 | 50,6 | 12,7 | 30,4 |
| Mezőkovácsháza | 1986 | 41,2 | 18,0 | 1,3 | 1,0 | 0,3 | 0,0 | 4,3 | 58,8 | 75,5 | 9,8 | 77,8 |
| Mindszent | 1993 | 42,7 | 22,2 | 1,4 | 1,0 | 0,1 | 0,0 | 0,0 | 42,7 | 73,2 | 2,3 | 74,3 |
| Monor | 1989 | 34,9 | 17,4 | 0,9 | 0,7 | 0,1 | 0,0 | 2,4 | 60,9 | 60,1 | 10,0 | 88,9 |
- 186/187 -
| Name of the city | Year | Dwellings per 100 citizens | Number of public lighting spots | Length of piped gas | Length of public water conduit | Length of public sewage network | Number of hospital beds per 1000 citizens | Number of classrooms per 100 secondary school students | Number of enterprises per 1000 citizens | Number of catering outlets per 10000 citizens | Proportion of commuters compared to total population | Proportion of non- agricultural wage- earners compared to total number of wage- earners |
| per 1 km downtown public roads | ||||||||||||
| Mór | 1984 | 36,4 | 23,2 | 1,2 | 0,8 | 0,3 | 13,2 | 2,9 | 47,7 | 27,2 | 8,6 | 86,5 |
| Mórahalom | 1989 | 42,2 | 17,9 | 2,1 | 1,0 | 0,8 | 0,0 | 0,0 | 53,2 | 34,8 | 4,0 | 59,4 |
| Nádudvar | 1989 | 39,8 | 14,0 | 1,6 | 0,9 | 0,1 | 0,0 | 0,0 | 39,8 | 27,0 | 3,4 | 34,6 |
| Nagyhalász | 1993 | 32,7 | 12,8 | 1,3 | 0,9 | 0,6 | 0,0 | 0,0 | 36,0 | 35,3 | 7,0 | 91,0 |
| Nagykálló | 1989 | 34,3 | 16,1 | 1,0 | 0,8 | 0,2 | 53,4 | 3,5 | 49,2 | 47,3 | 8,7 | 82,4 |
| Nagykáta | 1989 | 39,5 | 27,0 | 1,4 | 1,1 | 0,1 | 0,0 | 2,4 | 50,5 | 47,7 | 11,2 | 89,2 |
| Nyergesújfalu | 1989 | 34,9 | 19,7 | 1,0 | 1,2 | 2,0 | 0,0 | 4,7 | 59,6 | 49,6 | 19,2 | 98,0 |
| Nyíradony | 1992 | 34,7 | 19,5 | 1,5 | 1,1 | 0,2 | 0,0 | 0,0 | 40,5 | 48,3 | 2,3 | 74,4 |
| Pásztó | 1984 | 39,4 | 19,1 | 1,3 | 1,1 | 0,2 | 14,8 | 5,6 | 82,9 | 53,4 | 14,3 | 84,7 |
| Pécsvárad | 1993 | 35,7 | 15,2 | 1,1 | 0,4 | 0,2 | 0,0 | 0,0 | 77,2 | 84,2 | 19,9 | 81,2 |
| Pétervására | 1989 | 37,6 | 23,9 | 1,3 | 0,8 | 0,0 | 0,0 | 4,0 | 53,5 | 44,9 | 21,8 | 86,0 |
| Polgár | 1993 | 41,1 | 14,9 | 0,8 | 0,7 | 0,1 | 0,0 | 4,5 | 47,8 | 42,8 | 6,9 | 80,5 |
| Putnok | 1989 | 34,5 | 13,6 | 0,9 | 0,9 | 0,5 | 0,0 | 3,8 | 32,9 | 17,4 | 29,6 | 92,8 |
| Püspökladány | 1986 | 36,0 | 20,8 | 1,1 | 0,9 | 0,3 | 1,8 | 2,3 | 45,0 | 31,7 | 4,3 | 76,8 |
| Ráckeve | 1989 | 37,9 | 20,0 | 0,8 | 1,0 | 0,2 | 0,0 | 4,2 | 82,2 | 67,3 | 19,6 | 68,3 |
| Rétság | 1989 | 38,2 | 12,6 | 0,7 | 1,6 | 0,2 | 0,0 | 0,0 | 77,9 | 70,2 | 27,5 | 87,2 |
| Sajószentpéter | 1989 | 33,5 | 20,1 | 1,2 | 0,8 | 0,5 | 0,0 | 0,0 | 36,8 | 29,9 | 6,3 | 96,6 |
| Sárbogárd | 1986 | 36,6 | 12,5 | 1,5 | 0,8 | 0,4 | 0,0 | 0,0 | 45,1 | 48,3 | 9,5 | 81,4 |
| Sarkad | 1989 | 38,7 | 18,0 | 1,2 | 1,2 | 0,2 | 0,0 | 3,7 | 39,4 | 43,4 | 4,8 | 84,3 |
| Sásd | 1995 | 36,5 | 17,6 | 0,0 | 1,5 | 1,5 | 0,0 | 5,6 | 69,5 | 46,5 | 23,7 | 78,0 |
| Simontornya | 1995 | 41,5 | 14,6 | 0,0 | 0,9 | 0,2 | 0,0 | 0,0 | 46,1 | 74,0 | 17,5 | 94,8 |
| Soltvadkert | 1993 | 42,9 | 13,4 | 1,2 | 0,9 | 0,1 | 0,0 | 0,0 | 89,3 | 74,1 | 3,8 | 48,2 |
- 187/188 -
| Name of the city | Year | Dwellings per 100 citizens | Number of public lighting spots | Length of piped gas | Length of public water conduit | Length of public sewage network | Number of hospital beds per 1000 citizens | Number of classrooms per 100 secondary school students | Number of enterprises per 1000 citizens | Number of catering outlets per 10000 citizens | Proportion of commuters compared to total population | Proportion of non- agricultural wage- earners compared to total number of wage- earners |
| per 1 km downtown public roads | ||||||||||||
| Sümeg | 1984 | 36,3 | 32,2 | 1,4 | 1,7 | 0,7 | 41,4 | 4,7 | 64,6 | 67,3 | 21,5 | 84,6 |
| Szabadszállás | 1995 | 46,8 | 14,3 | 1,6 | 0,7 | 0,0 | 3,1 | 5,6 | 43,0 | 40,9 | 1,9 | 63,0 |
| Szécsény | 1986 | 38,1 | 25,1 | 1,3 | 2,1 | 0,9 | 0,0 | 5,5 | 62,9 | 48,7 | 21,2 | 84,0 |
| Szeghalom | 1984 | 37,7 | 23,3 | 1,6 | 1,4 | 0,2 | 12,5 | 3,6 | 49,2 | 57,5 | 12,3 | 79,0 |
| Szentgotthárd | 1983 | 33,6 | 31,5 | 1,4 | 1,0 | 0,5 | 16,1 | 4,5 | 52,0 | 65,3 | 20,1 | 89,3 |
| Szerencs | 1984 | 37,4 | 23,9 | 2,1 | 0,7 | 0,3 | 0,0 | 3,8 | 53,4 | 35,3 | 35,4 | 87,4 |
| Szigetszentmiklós 1986 | 38,2 | 30,4 | 1,5 | 1,3 | 0,4 | 0,0 | 3,5 | 87,2 | 45,5 | 21,5 | 91,3 | |
| Szikszó | 1989 | 35,1 | 18,5 | 1,6 | 1,1 | 0,2 | 51,2 | 4,9 | 42,2 | 45,6 | 9,3 | 87,8 |
| Tab | 1989 | 37,0 | 23,0 | 0,0 | 0,7 | 0,4 | 0,0 | 2,8 | 66,6 | 69,6 | 24,2 | 91,5 |
| Tamási | 1984 | 41,5 | 21,7 | 0,0 | 1,0 | 0,3 | 0,0 | 3,4 | 71,4 | 72,5 | 14,1 | 74,1 |
| Téglás | 1991 | 32,8 | 12,8 | 1,6 | 1,0 | 0,4 | 0,0 | 0,0 | 29,0 | 34,2 | 0,0 | 73,9 |
| Tiszaföldvár | 1993 | 38,9 | 14,3 | 1,4 | 1,0 | 0,2 | 0,0 | 4,4 | 39,6 | 31,6 | 2,6 | 73,8 |
| Tiszafüred | 1984 | 38,5 | 18,4 | 1,3 | 1,0 | 0,3 | 0,0 | 5,0 | 49,4 | 48,4 | 3,9 | 85,8 |
| Tiszakécske | 1986 | 41,7 | 21,6 | 1,2 | 1,1 | 0,1 | 0,0 | 4,2 | 62,0 | 111,4 | 2,2 | 76,8 |
| Tiszalök | 1992 | 37,9 | 20,7 | 1,7 | 2,0 | 0,3 | 0,0 | 4,7 | 40,8 | 81,4 | 13,9 | 82,9 |
| Tiszavasvári | 1986 | 32,9 | 19,1 | 1,1 | 0,8 | 0,2 | 0,0 | 3,0 | 35,3 | 69,2 | 3,4 | 82,8 |
| Tokaj | 1986 | 37,1 | 21,5 | 1,0 | 1,0 | 0,4 | 0,0 | 3,3 | 52,2 | 117,2 | 14,4 | 92,0 |
| Tolna | 1989 | 37,3 | 16,7 | 1,7 | 1,2 | 0,6 | 0,0 | 5,2 | 64,4 | 40,0 | 8,0 | 89,4 |
| Tótkomlós | 1993 | 44,4 | 17,8 | 1,2 | 1,0 | 0,1 | 0,0 | 3,4 | 48,7 | 69,4 | 2,7 | 62,4 |
| Újfehértó | 1992 | 33,0 | 13,9 | 1,3 | 0,9 | 0,3 | 0,0 | 3,1 | 39,5 | 35,1 | 2,0 | 77,5 |
| Vasvár | 1986 | 39,8 | 43,6 | 0,0 | 0,9 | 0,2 | 0,0 | 3,2 | 63,7 | 59,1 | 13,6 | 75,5 |
- 188/189 -
| Name of the city | Year | Dwellings per 100 citizens | Number of public lighting spots | Length of piped gas | Length of public water conduit | Length of public sewage network | Number of hospital beds per 1000 citizens | Number of classrooms per 100 secondary school students | Number of enterprises per 1000 citizens | Number of catering outlets per 10000 citizens | Proportion of commuters compared to total population | Proportion of non- agricultural wage- earners compared to total number of wage- earners |
| per 1 km downtown public roads | ||||||||||||
| Záhony | 1989 | 35,9 | 29,7 | 2,0 | 2,6 | 1,6 | 0,0 | 3,2 | 47,6 | 43,5 | 84,6 | 98,2 |
| Zalaszentgrót | 1984 | 38,5 | 16,7 | 1,2 | 1,4 | 0,2 | 0,0 | 4,1 | 60,8 | 75,1 | 6,9 | 82,9 |
| Zirc | 1984 | 36,6 | 22,1 | 0,0 | 1,8 | 1,1 | 13,6 | 3,9 | 67,5 | 42,1 | 9,3 | 82,8 |
| Average city | 37,6 | 18,3 | 1,1 | 1,0 | 0,3 | 3,3 | 3,8 | 55,7 | 59,0 | 11,5 | 79,2 | |
- 189/190 -
In general:
Let a1, a2, ..., am be the criteria on grounds of which we wish to rank cities A1 A2, ..., An , and the elements of matrix A the data of the given cities regarding the specified criteria:
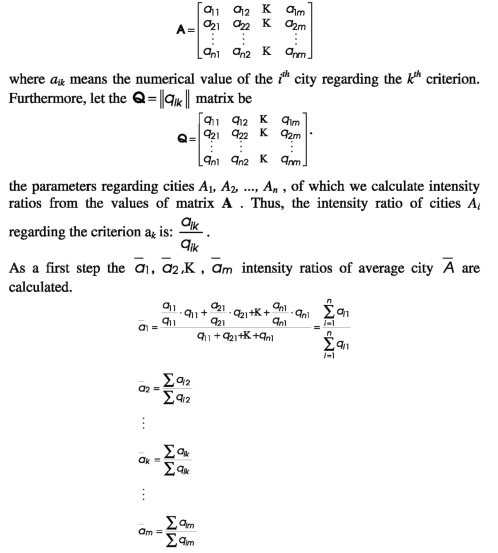
While intensity ratios demonstrate the ranking order of cities within a single criterion, they are not suitable for summarizing, since they are expressed with different units of measurement. Neither do intensity ratios allow us to specify which criteria represent a higher degree of urbanization, and which reflect the deficiencies in the case of a single city.
- 190/191 -
The next step is to define the supply indices for all the cities, concerning all calculated criteria by dividing the intensity ratio of the selected city by the corresponding intensity ratio of the average city, and multiplying the quotient by one hundred, so that we get the result in percentage. It is evident that all the supply indices of the "average city" are 100%. Of course the supply indices gained this way will not measure the degree of supply, but they will measure the relative supply within the circle of the cities studied, as the parameters of the "average city" have been calculated from the parameters of the cities studied. The supply indices are presented in Table no.2.
By using the nominations from above the supply index bik of city Ai regarding criteria ak:

The B matrix of these supply indices:

These supply indices enable us to compare the studied cities not only on the basis of a certain selected criterion, but also on the basis of all the indices present in a line next to the name of a city, that is, the indices referring to diverse criteria.
Finally, the complex indices of cities are interpreted as follows: by considering the supply indices to be a vector-coordinate, we consider the length of the vector (the square root extracted from the sum of the squares of the supply indices) as being the complex index. The complex index calculated from the supply indices of the 104 cities is presented in the last column of Table no.2. Since all the supply indices of the average city are 100%, its complex index depends exclusively on the number of the indices selected, which in the present case is 331,7.
Regarding the above, the complex index Ki of city Ai is no other, than the absolute value of the m-dimension row-vector created from the I[th] row of matrix B .

- 191/192 -
Table no.2.
The supply indices and complex index of the 104 cities
| Name of the city | Year | Wim dwel- lings | With public lights | With piped gas | With public water conduit | With public sewage network | With hospital beds | With secondary school classrooms | With enterprises | With catering outlets | Propor- tion of commu- ters | Non- agricultural wage- earners | Complex index |
| supply index (supplied with the above) expressed in percentage of the average city | |||||||||||||
| Nádudvar | 1989 | 105,8 | 76,7 | 137,4 | 90,1 | 16,6 | 0,0 | 0,0 | 71,4 | 45,8 | 28,9 | 43,7 | 233,0 |
| Gyomaendrőd | 1989 | 109,8 | 35,7 | 42,8 | 37,8 | 31,6 | 42,2 | 102,4 | 103,8 | 88,5 | 29,7 | 89,4 | 239,5 |
| Enying | 1992 | 91,7 | 70,2 | 118,8 | 87,9 | 16,0 | 0,0 | 82,5 | 86,4 | 74,1 | 44,6 | 82,4 | 252,9 |
| Battonya | 1989 | 130,2 | 67,0 | 76,3 | 68,4 | 47,4 | 0,0 | 97,8 | 58,9 | 94,2 | 18,7 | 87,7 | 253,2 |
| Dunaföldvár | 1989 | 76,6 | 90,8 | 100,5 | 75,8 | 49,4 | 0,0 | 116,0 | 75,2 | 74,0 | 24,2 | 102,3 | 260,8 |
| Újfehértó | 1992 | 87,6 | 76,1 | 117,1 | 91,6 | 91,0 | 0,0 | 81,5 | 70,9 | 59,5 | 16,7 | 97,8 | 262,5 |
| Polgár | 1993 | 109,2 | 81,3 | 70,4 | 69,3 | 19,3 | 0,0 | 118,4 | 85,8 | 72,5 | 59,2 | 101,6 | 262,9 |
| Derecske | 1991 | 94,7 | 89,3 | 94,5 | 81,9 | 42,8 | 0,0 | 87,7 | 119,1 | 54,1 | 26,0 | 98,2 | 263,7 |
| Jánoshalma | 1989 | 115,4 | 70,3 | 113,2 | 79,6 | 32,6 | 0,0 | 123,5 | 92,4 | 58,3 | 22,3 | 73,8 | 267,6 |
| Kecel | 1993 | 114,5 | 123,0 | 131,1 | 99,9 | 0,0 | 0,0 | 0,0 | 95,6 | 69,0 | 20,3 | 55,3 | 269,8 |
| Jászfényszaru | 1993 | 119,6 | 137,4 | 93,7 | 102,6 | 0,0 | 0,0 | 0,0 | 65,1 | 56,1 | 57,9 | 99,4 | 270,3 |
| Lengyeltóti | 1992 | 91,6 | 125,0 | 91,8 | 110,3 | 0,0 | 0,0 | 0,0 | 96,7 | 59,8 | 96,8 | 85,0 | 272,3 |
| Tiszavasvári | 1986 | 87,5 | 104,5 | 93,6 | 86,4 | 72,9 | 0,0 | 80,0 | 63,4 | 117,2 | 28,6 | 104,5 | 275,6 |
| Püspökladány | 1986 | 95,9 | 113,4 | 100,4 | 90,7 | 93,0 | 55,7 | 62,0 | 80,8 | 53,7 | 36,3 | 97,0 | 275,8 |
| Tiszaföldvár | 1993 | 103,5 | 78,0 | 120,8 | 99,3 | 70,0 | 0,0 | 116,5 | 71,1 | 53,5 | 22,3 | 93,2 | 277,1 |
| Csurgó | 1989 | 97,0 | 67,0 | 45,4 | 46,7 | 45,1 | 0,0 | 115,4 | 110,0 | 78,2 | 130,3 | 90,4 | 277,2 |
| Kunszentmiklós | 1989 | 104,4 | 71,9 | 94,6 | 80,3 | 42,3 | 0,0 | 138,1 | 91,0 | 57,5 | 49,2 | 104,0 | 277,7 |
| Nyíradony | 1992 | 92,4 | 106,6 | 127,6 | 118,7 | 77,5 | 0,0 | 0,0 | 72,7 | 81,8 | 19,6 | 93,9 | 278,3 |
| Hajdúdorog | 1989 | 106,1 | 92,8 | 114,9 | 99,2 | 50,1 | 0,0 | 113,3 | 77,2 | 73,8 | 8,2 | 90,2 | 279,1 |
| Monor | 1989 | 92,7 | 95,1 | 78,9 | 77,7 | 45,0 | 0,0 | 64,4 | 109,5 | 101,7 | 84,8 | 112,3 | 279,6 |
| Bácsalmás | 1986 | 117,5 | 79,5 | 151,1 | 68,3 | 18,3 | 0,0 | 94,3 | 84,9 | 36,1 | 98,2 | 78,0 | 284,8 |
| Ibrány | 1993 | 88,7 | 69,3 | 83,6 | 93,2 | 154,7 | 0,0 | 90,6 | 71,4 | 67,9 | 18,5 | 104,3 | 285,3 |
| Kunszentmárton | 1986 | 110,3 | 111,4 | 68,9 | 95,4 | 91,3 | 0,0 | 72,4 | 88,9 | 87,0 | 68,6 | 97,9 | 285,9 |
| Jászapáti | 1989 | 103,1 | 130,4 | 113,5 | 111,5 | 18,8 | 0,0 | 74,4 | 70,9 | 91,1 | 35,2 | 96,7 | 287,7 |
| Tótkomlós | 1993 | 118,2 | 97,4 | 109,1 | 107,0 | 20,4 | 0,0 | 90,2 | 87,5 | 117,6 | 23,2 | 78,8 | 289,1 |
| Csenger | 1989 | 97,1 | 102,7 | 139,4 | 76,8 | 43,5 | 0,0 | 89,8 | 94,4 | 75,0 | 77,9 | 91,1 | 290,2 |
| Sarkad | 1989 | 102,9 | 98,0 | 106,9 | 123,9 | 65,7 | 0,0 | 97,4 | 70,8 | 73,6 | 40,8 | 106,4 | 290,2 |
| Jászárokszállás | 1991 | 119,4 | 57,9 | 72,1 | 87,4 | 52,8 | 0,0 | 164,1 | 88,2 | 81,0 | 25,3 | 98,3 | 291,2 |
| Lajosmizse | 1993 | 108,5 | 121,0 | 123,7 | 87,0 | 65,9 | 0,0 | 0,0 | 121,9 | 90,4 | 48,6 | 76,8 | 291,4 |
- 192/193 -
| Name of the city | Year | With dwel- lings | With public lights | With piped gas | With public water conduit | With public sewage network | With hospital beds | With secondary school classrooms | With enterprises | With catering outlets | Propor- tion of commu- ters | Non- agricultural wage- earners | Complex index |
| supply index (supplied with the above) expressed in percentage of the average city | |||||||||||||
| Máriapócs | 1993 | 82,5 | 86,0 | 95,6 | 81,3 | 10,2 | 0,0 | 0,0 | 66,7 | 93,2 | 191,5 | 72,4 | 291,7 |
| Soltvadkert | 1993 | 114,1 | 73,2 | 105,9 | 93,3 | 32,6 | 0,0 | 0,0 | 160,4 | 125,5 | 32,2 | 60,9 | 292,6 |
| Sajószentpéter | 1989 | 89,0 | 109,8 | 102,7 | 88,1 | 156,5 | 0,0 | 0,0 | 66,1 | 50,7 | 53,5 | 121,9 | 295,7 |
| Mindszent | 1993 | 113,7 | 121,2 | 126,2 | 106,9 | 47,5 | 0,0 | 0,0 | 76,8 | 124,1 | 20,0 | 93,8 | 296,1 |
| Dabas | 1989 | 97,8 | 83,1 | 109,8 | 70,4 | 44,9 | 0,0 | 107,2 | 140,8 | 86,5 | 75,5 | 88,4 | 296,3 |
| Sárbogárd | 1986 | 97,2 | 68,3 | 127,6 | 85,1 | 143,3 | 0,0 | 0,0 | 81,1 | 81,9 | 81,0 | 102,7 | 297,6 |
| Téglás | 1991 | 87,1 | 69,9 | 136,6 | 109,1 | 130,5 | 0,0 | 0,0 | 52,1 | 57,9 | 121,0 | 93,3 | 299,1 |
| Simontornya | 1995 | 110,3 | 79,6 | 0,0 | 91,4 | 66,3 | 0,0 | 0,0 | 82,8 | 125,3 | 148,8 | 119,7 | 300,5 |
| Mezőberény | 1989 | 104,7 | 112,4 | 117,8 | 117,6 | 96,3 | 0,0 | 93,4 | 85,0 | 57,6 | 26,9 | 100,4 | 301,0 |
| Kunhegyes | 1989 | 103,6 | 92,3 | 115,7 | 111,0 | 78,9 | 69,2 | 91,3 | 82,6 | 90,4 | 61,2 | 91,5 | 302,4 |
| Nagyhalász | 1993 | 87,1 | 70,1 | 114,4 | 97,7 | 179,5 | 0,0 | 0,0 | 64,6 | 59,8 | 59,7 | 114,9 | 303,0 |
| Hajdúhadház | 1991 | 85,7 | 129,6 | 124,0 | 108,6 | 12,5 | 0,0 | 120,0 | 44,1 | 35,9 | 121,1 | 93,3 | 304,1 |
| Balmazújváros | 1989 | 91,0 | 94,9 | 133,3 | 137,6 | 83,9 | 0,0 | 111,5 | 74,2 | 85,3 | 11,1 | 78,4 | 304,2 |
| Kistelek | 1989 | 117,5 | 68,5 | 148,8 | 92,8 | 55,9 | 0,0 | 92,2 | 112,1 | 83,2 | 66,3 | 99,6 | 307,7 |
| Szabadszállás | 1995 | 124,6 | 77,8 | 138,0 | 75,6 | 0,0 | 95,8 | 147,8 | 77,2 | 69,3 | 16,5 | 79,5 | 307,8 |
| Bátonyterenye | 1989 | 106,8 | 104,4 | 71,5 | 115,6 | 121,3 | 0,0 | 66,9 | 74,5 | 52,8 | 131,1 | 119,0 | 315,7 |
| Biharkeresztes | 1989 | 102,9 | 117,7 | 120,2 | 86,2 | 36,1 | 0,0 | 83,1 | 83,1 | 79,2 | 147,1 | 103,4 | 316,3 |
| Nagykáta | 1989 | 105,0 | 147,2 | 123,5 | 112,0 | 24,3 | 0,0 | 62,7 | 90,6 | 80,8 | 95,5 | 112,6 | 318,7 |
| Tiszafüred | 1984 | 102,5 | 100,5 | 116,2 | 100,9 | 113,7 | 0,0 | 131,3 | 88,7 | 81,9 | 32,8 | 108,3 | 319,1 |
| Kiskunmajsa | 1989 | 109,9 | 116,9 | 121,6 | 99,7 | 45,2 | 0,0 | 103,0 | 105,7 | 144,3 | 37,9 | 77,8 | 320,3 |
| Mezőcsát | 1991 | 99,2 | 86,0 | 197,7 | 102,8 | 45,4 | 0,0 | 118,9 | 79,9 | 74,3 | 32,4 | 92,6 | 323,4 |
| Lőrinci | 1992 | 105,7 | 85,4 | 110,3 | 146,2 | 59,4 | 0,0 | 0,0 | 60,8 | 79,5 | 160,7 | 119,1 | 324,9 |
| Tamási | 1984 | 110,5 | 118,2 | 0,0 | 100,7 | 90,6 | 0,0 | 90,3 | 128,2 | 122,9 | 120,1 | 93,6 | 327,7 |
| Átlagváros | 100 | 100 | 100 | 100 | 100 | 100 | 100 | 100 | 100 | 100 | 100 | 331,7 | |
| Csepreg | 1995 | 96,8 | 138,4 | 123,3 | 96,8 | 148,5 | 0,0 | 78,7 | 114,7 | 69,8 | 63,9 | 85,6 | 332,8 |
| Mezőkovácsháza | 1986 | 109,5 | 98,1 | 113,1 | 107,9 | 88,7 | 0,0 | 113,8 | 105,6 | 128,0 | 83,2 | 98,3 | 333,1 |
| Pécsvárad | 1993 | 94,8 | 82,9 | 95,4 | 43,6 | 73,4 | 0,0 | 0,0 | 138,7 | 142,6 | 169,4 | 102,5 | 333,2 |
| Zalaszentgrót | 1984 | 102,4 | 91,0 | 108,9 | 150,4 | 65,3 | 0,0 | 107,2 | 109,2 | 127,1 | 59,0 | 104,6 | 333,9 |
| Abony | 1993 | 101,7 | 98,5 | 104,0 | 98,0 | 130,2 | 0,0 | 199,2 | 74,3 | 53,3 | 11,2 | 101,7 | 340,5 |
| Bátaszék | 1995 | 97,2 | 111,7 | 135,8 | 116,2 | 94,6 | 0,0 | 113,7 | 106,6 | 78,3 | 110,4 | 103,6 | 340,8 |
| Pétervására | 1989 | 100,0 | 130,3 | 112,9 | 79,6 | 0,0 | 0,0 | 105,6 | 96,0 | 76,1 | 186,0 | 108,6 | 344,4 |
| Tiszakécske | 1986 | 111,0 | 117,8 | 103,8 | 113,9 | 44,7 | 0,0 | 110,4 | 111,4 | 188,7 | 18,5 | 96,9 | 349,2 |
- 193/194 -
| Name of the city | Year | With dwel- lings | With public lights | With piped gas | With public water conduit | With public sewage network | With hospital beds | With secondary school classrooms | With enterprises | With catering outlets | Propor- tion of commu- ters | Non- agricultural wage- earners | Complex index |
| supply index (supplied with the above) expressed in percentage of the average city | |||||||||||||
| Fertőd | 1995 | 84,8 | 49,9 | 70,5 | 73,4 | 17,3 | 0,0 | 113,9 | 136,5 | 148,5 | 205,6 | 83,2 | 351,0 |
| Aszód | 1991 | 97,4 | 91,1 | 102,6 | 99,7 | 102,2 | 0,0 | 121,1 | 103,0 | 120,0 | 146,2 | 118,4 | 351,8 |
| Ráckeve | 1989 | 100,8 | 109,4 | 70,7 | 106,8 | 55,0 | 0,0 | 111,0 | 147,7 | 114,1 | 167,4 | 86,2 | 352,4 |
| Encs | 1984 | 86,5 | 91,4 | 0,0 | 89,4 | 156,5 | 0,0 | 119,6 | 97,0 | 120,8 | 160,9 | 110,9 | 353,3 |
| Heves | 1984 | 96,7 | 122,9 | 118,5 | 114,1 | 194,1 | 0,0 | 86,1 | 90,0 | 82,8 | 75,2 | 102,8 | 357,5 |
| Balatonalmádi | 1989 | 118,9 | 85,4 | 45,8 | 65,2 | 130,8 | 0,0 | 85,4 | 188,4 | 130,2 | 92,3 | 122,0 | 357,8 |
| Füzesabony | 1989 | 99,4 | 117,4 | 123,2 | 117,5 | 58,0 | 0,0 | 80,0 | 99,2 | 74,2 | 198,0 | 111,1 | 359,6 |
| Vasvár | 1986 | 105,8 | 238,1 | 0,0 | 89,3 | 68,9 | 0,0 | 85,1 | 114,4 | 100,1 | 115,6 | 95,2 | 365,2 |
| Bicske | 1986 | 94,2 | 103,4 | 38,3 | 131,5 | 172,3 | 0,0 | 119,6 | 94,2 | 87,3 | 150,5 | 113,4 | 366,5 |
| Tab | 1989 | 98,4 | 125,5 | 0,0 | 76,8 | 142,9 | 0,0 | 72,8 | 119,7 | 117,9 | 206,0 | 115,5 | 375,6 |
| Tokaj | 1986 | 98,8 | 117,3 | 90,1 | 107,3 | 115,9 | 0,0 | 88,0 | 93,7 | 198,6 | 122,7 | 116,2 | 375,6 |
| Putnok | 1989 | 91,7 | 74,1 | 79,4 | 97,4 | 162,3 | 0,0 | 101,0 | 59,0 | 29,4 | 252,4 | 117,1 | 384,7 |
| Rétság | 1989 | 101,7 | 68,7 | 62,0 | 161,7 | 53,4 | 0,0 | 0,0 | 139,9 | 118,9 | 234,3 | 110,1 | 385,6 |
| Tolna | 1989 | 99,2 | 91,2 | 149,0 | 124,1 | 200,5 | 0,0 | 138,4 | 115,7 | 67,7 | 68,4 | 112,9 | 388,0 |
| Baktalórántháza | 1993 | 85,9 | 80,6 | 147,6 | 104,4 | 109,2 | 0,0 | 72,9 | 72,5 | 112,4 | 242,9 | 103,3 | 389,1 |
| Mórahalom | 1989 | 112,3 | 97,6 | 183,1 | 102,7 | 260,0 | 0,0 | 0,0 | 95,5 | 59,0 | 33,9 | 74,9 | 391,4 |
| Tiszalök | 1992 | 100,9 | 113,0 | 149,6 | 203,2 | 91,6 | 0,0 | 123,5 | 73,4 | 137,8 | 118,3 | 104,7 | 399,4 |
| Szigetszentmiklós | 1986 | 101,5 | 166,1 | 127,1 | 137,9 | 143,9 | 0,0 | 91,6 | 156,6 | 77,0 | 182,8 | 115,2 | 423,4 |
| Letenye | 1989 | 85,3 | 109,4 | 124,0 | 112,1 | 314,5 | 0,0 | 0,0 | 96,0 | 117,1 | 108,6 | 105,4 | 438,0 |
| Szerencs | 1984 | 99,6 | 130,4 | 180,5 | 73,0 | 86,1 | 0,0 | 100,4 | 95,9 | 59,7 | 301,8 | 110,3 | 445,3 |
| Dorog | 1984 | 63,1 | 137,6 | 89,4 | 212,8 | 244,7 | 112,4 | 111,1 | 66,7 | 61,7 | 226,9 | 123,8 | 486,0 |
| Mór | 1984 | 96,7 | 126,6 | 109,2 | 82,5 | 94,3 | 401,4 | 75,8 | 85,6 | 46,1 | 73,4 | 109,2 | 496,6 |
| Szécsény | 1986 | 101,4 | 136,7 | 112,1 | 222,4 | 282,3 | 0,0 | 144,4 | 113,0 | 82,4 | 180,3 | 106,0 | 504,8 |
| Szeghalom | 1984 | 100,3 | 127,2 | 141,3 | 149,0 | 75,7 | 379,8 | 93,8 | 88,4 | 97,4 | 104,9 | 99,7 | 515,2 |
| Balatonboglár | 1991 | 114,4 | 119,1 | 105,9 | 59,6 | 152,3 | 0,0 | 142,7 | 184,2 | 155,3 | 339,1 | 94,3 | 517,2 |
| Mezőhegyes | 1989 | 121,0 | 187,4 | 196,2 | 157,6 | 97,9 | 354,8 | 96,2 | 62,5 | 85,7 | 108,6 | 38,4 | 531,4 |
| Budaörs | 1986 | 98,3 | 124,2 | 133,2 | 97,6 | 324,4 | 0,0 | 93,1 | 227,2 | 97,7 | 240,1 | 114,6 | 546,1 |
| Pásztó | 1984 | 104,7 | 104,3 | 113,8 | 111,2 | 54,0 | 451,8 | 146,6 | 148,8 | 90,4 | 121,6 | 106,9 | 576,4 |
| Kisbér | 1986 | 98,0 | 80,3 | 153,3 | 161,5 | 17,6 | 479,5 | 141,9 | 106,9 | 66,1 | 125,6 | 99,1 | 597,9 |
| Gárdony | 1989 | 100,5 | 101,4 | 104,9 | 111,1 | 172,1 | 0,0 | 0,0 | 130,7 | 509,7 | 95,1 | 89,8 | 606,1 |
| Sásd | 1995 | 97,2 | 96,0 | 0,0 | 154,8 | 499,1 | 0,0 | 146,6 | 124,7 | 78,7 | 201,7 | 98,4 | 620,8 |
| Szentgotthárd | 1983 | 89,3 | 171,8 | 120,4 | 108,4 | 174,0 | 488,7 | 117,9 | 93,5 | 110,7 | 171,5 | 112,8 | 640,2 |
- 194/195 -
| Name of the city | Year | With dwel- lings | With public lights | With piped gas | With public water conduit | With public sewage network | With hospital beds | With secondary school classrooms | With enterprises | With catering outlets | Propor- tion of commu- ters | Non- agricultural wage- earners | Complex index |
| supply index (supplied with the above) expressed in percentage of the average city | |||||||||||||
| Zirc | 1984 | 97,5 | 120,5 | 0,0 | 189,0 | 362,5 | 413,6 | 104,0 | 121,3 | 71,4 | 79,2 | 104,5 | 640,3 |
| Martfű | 1989 | 95,4 | 141,6 | 115,0 | 149,9 | 472,1 | 0,0 | 85,1 | 87,1 | 54,6 | 303,5 | 115,4 | 641,1 |
| Edelény | 1986 | 86,2 | 81,4 | 103,8 | 107,8 | 123,5 | 638,8 | 144,2 | 73,1 | 64,9 | 82,6 | 106,5 | 712,9 |
| Nyergesújfalu | 1989 | 92,7 | 107,5 | 84,9 | 127,3 | 639,4 | 0,0 | 124,8 | 107,1 | 84,0 | 163,3 | 123,7 | 727,0 |
| Balatonlelle | 1991 | 113,3 | 146,0 | 62,8 | 114,7 | 299,7 | 0,0 | 0,0 | 192,4 | 635,2 | 339,0 | 94,3 | 839,9 |
| Záhony | 1989 | 95,6 | 162,0 | 171,0 | 273,8 | 509,9 | 0,0 | 84,8 | 85,5 | 73,6 | 720,4 | 124,0 | 976,6 |
| Fonyód | 1989 | 107,4 | 126,9 | 53,3 | 113,8 | 103,6 | 0,0 | 92,1 | 212,2 | 885,5 | 267,6 | 103,6 | 987,0 |
| Balatonföldvár | 1992 | 121,9 | 173,1 | 82,5 | 133,7 | 395,4 | 0,0 | 0,0 | 233,9 | 988,5 | 326,9 | 116,8 | 1174,0 |
| Sümeg | 1984 | 96,5 | 176,0 | 123,9 | 180,1 | 238,6 | 1261,3 | 123,5 | 116,1 | 114,0 | 182,9 | 106,8 | 1350,0 |
| Szikszó | 1989 | 93,2 | 101,2 | 140,7 | 116,1 | 67,3 | 1558,0 | 128,7 | 75,8 | 77,3 | 79,0 | 110,9 | 1590,9 |
| Nagykálló | 1989 | 91,2 | 87,8 | 87,8 | 87,0 | 77,5 | 1624,0 | 93,1 | 88,4 | 80,1 | 73,9 | 104,0 | 1647,3 |
| Héviz | 1992 | 122,1 | 134,8 | 126,2 | 92,3 | 125,4 | 3743,6 | 130,5 | 264,8 | 607,8 | 416,0 | 117,6 | 3838,1 |
- 195/196 -
The supply indices defined above bear the following significant features:
1. Supply indices regarding one single criterion provide the same grade of development in relation to the cities studied like the corresponding intensity ratios, since the supply index regarding any city with the exception of the
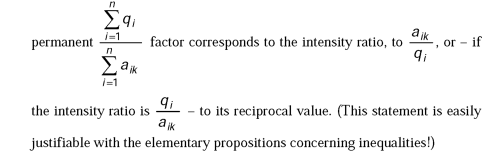
2. In case a change occurs in the number of settlements subject to the study, the indices of the recently introduced or omitted cities will not influence the ranking order of supply of the cities already ranked during the investigation. (They will definitely modify the numerical value of the supply indices and the complex index, but will not alter the order of priorities among the cities!) This characteristic feature of the supply indices originates from the fact that the place of the city in the ranking list of development is decided
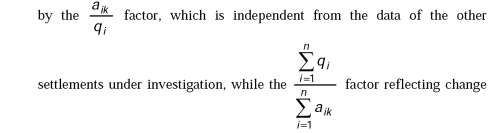
is present in the supply indices of every settlement, and consequently will not alter or influence their ranking list.
According to the results of the study the complex index of the average city is 331,7, which means that in the list of the cities ranked according to the value of their complex indices the average city is situated between Tamási and Csepreg, 52 cities precede it in the list and it is followed by the complex indices of 52 cities. Nádudvar and Gyomaendrőd have the lowest complex index values: below 250, while 50 cities are scaled between 250 and the average city. The dispersion of cities with complex index values higher than the average city is considerably larger: there are 25 cities between the average city and 400, 12
- 196/197 -
cities between 400 and 600, 8 cities between 600 and 900 and the complex index of 7 cities is above 900, these cities are:
| Záhony | 976,6 |
| Fonyód | 987,0 |
| Balatonföldvár | 1174,0 |
| Sümeg | 1350,0 |
| Szikszó | 1590,9 |
| Nagykálló | 1647,3 |
| Hévíz | 3838,1 |
The indices of the latter 4 cities were primarily increased by the abundant hospital supply, but in the case of Hévíz the supply of public utilities, the level of catering networks and the proportion of commuters are also very high. In cities at Lake Balaton the index is raised by the catering network and the ratio of commuters, in Záhony it is the ratio of commuters that is especially high. In the case of cities with the lowest indices it is the lack of hospitals or secondary schools, or the overcrowdedness of the latter, the low level of public utilities and consequently the poor presence of entrepreneurs and catering outlets, the less attraction are the factors that shape the value of the index.
I only examined the ranking order among the 104 new cities that have been formed between 1983 and 1995. Even from this examination we can draw the conclusion that among these cities there are several, which well deserve the status of the city, there are others the legal status of which can be justified, but quite a number of them fall far behind the criteria of urbanisation.
As a next step it would have been necessary to compare these new cities with the old network of cities of the country. As such a study would have doubled the amount of work with collecting and fixing data, I did not tackle more than randomly selecting from among the old cities 11 smaller ones with their population not exceeding 30000. It was not my intention to compare the new cities with the most developed Hungarian big cities. The date of being granted the legal status and the number of population of the selected 11 cities are as follows:
- 197/198 -
Table no.3
| Name of the city | Legal status given in | Number of population |
| Ajka | 1959 | 32944 |
| Celldömölk | 1978 | 11865 |
| Esztergom | before 1900 | 28268 |
| Hatvan | 1945 | 23927 |
| Komárom | before 1900 | 19728 |
| Kőszeg | before 1900 | 11716 |
| Mátészalka | 1969 | 18478 |
| Nagykőrös | before 1900 | 26564 |
| Sárospatak | 1968 | 14889 |
| Szarvas | 1966 | 18406 |
| Tapolca | 1966 | 18391 |
The supply indices compared to the average city of the 11 cities would only demonstrate the order of the 11 cities, but would not be suitable for the comparison with the 104 new cities. Therefore I applied a standardization process and defined the supply indices by dividing the intensity ratios of the 11 cities by the parameters of the average city calculated from the 104 cities. These are presented in Table no.4 below, where the complex indices are also presented in the last column.
- 198/199 -
Table no. 4
The supply indices and the standardized complex index of the 11 cities*
| Name of the city | With dwel- lings | With public lights | With piped gas | With public water conduit | With public sewage network | With hospital beds | With secondary school classrooms | With enterprises | With catering outlets | Proportion of commuters | Non-agri- cultural wage- earners | Complex index |
| supply index (supplied with the above) expressed in percentage of the average city | ||||||||||||
| Ajka | 97,4 | 185,5 | 77,3 | 151,8 | 144,9 | 492,4 | 77,3 | 97,0 | 90,0 | 116,2 | 121,8 | 623,1 |
| Celldömölk | 102,2 | 479,0 | 114,1 | 99,1 | 94,9 | 230,9 | 83,7 | 84,2 | 70,0 | 152,1 | 117,2 | 617,1 |
| Esztergom | 102,6 | 159,5 | 97,7 | 92,3 | 114,2 | 671,8 | 92,6 | 142,9 | 213,9 | 93,6 | 121,6 | 785,3 |
| Hatvan | 100,3 | 99,0 | 95,0 | 87,2 | 46,0 | 582,6 | 73,5 | 101,8 | 100,5 | 124,9 | 116,0 | 658,0 |
| Komárom | 100,9 | 91,7 | 87,1 | 105,5 | 194,4 | 287,0 | 109,7 | 125,9 | 174,3 | 91,9 | 106,3 | 485,2 |
| Kőszeg | 95,6 | 228,7 | 95,0 | 130,8 | 179,9 | 0,0 | 91,0 | 91,7 | 118,6 | 88,2 | 121,4 | 416,1 |
| Mátészalka | 96,5 | 191,1 | 94,1 | 113,7 | 290,9 | 805,4 | 81,5 | 123,1 | 112,8 | 284,4 | 115,6 | 964,2 |
| Nagykőrös | 99,0 | 150,8 | 93,1 | 51,4 | 75,1 | 137,5 | 81,1 | 88,0 | 56,1 | 24,0 | 104,5 | 312,0 |
| Sárospatak | 92,8 | 162,2 | 0,0 | 131,0 | 183,7 | 0,0 | 90,8 | 90,3 | 117,2 | 122,3 | 102,2 | 376,0 |
| Szarvas | 109,9 | 108,5 | 130,4 | 129,6 | 265,3 | 51,3 | 106,4 | 141,2 | 135,3 | 73,9 | 92,3 | 440,7 |
| Tapolca | 96,3 | 120,3 | 66,2 | 126,4 | 122,1 | 337,6 | 102,6 | 126,9 | 70,0 | 97,6 | 114,3 | 476,6 |
* Magyarország városai, (The Cities of Hungary) Budapest, ÉGISZ Kiadó, 1996.
- 199/200 -
We can state that the complex indices of all the cities except Nagykőrös are higher, than that of the average city, but there is not as much diversity as among the new cities. Out of these cities Mátészalka has the highest complex index, 964,2, which is not only far from that of Hévíz, but does not even attain the complex indices of Balatonföldvár, Sümeg, Szikszó and Nagykálló. The complex indices of nearly all the cities were increased by the supply of hospitals, except for Kőszeg and Sárospatak, where there are no hospitals and Szarvas, where the number of hospital beds is low. All of them are above average as regards public lighting, except Hatvan and Komárom, which are also close to the level of the average city in this respect. It seems that the supply of public utilities did not improve as much in these old cities as in those new ones, where the whole system of public utilities was developed at the same time, on the account of being granted the legal status of a city. The supply of classrooms in most of these cities does not exceed the average, while their secondary schools provide educational opportunities for the students living in the neighbouring areas as well. The number of enterprises is either around or above average, the supply of catering outlets is fairly high in Esztergom, Komárom, Kőszeg, Mátészalka, Sárospatak and Szarvas, in the other five cities it is either average or low. The proportion of commuters reflecting attraction, and non-agricultural wage earners expressing urbanization is high in almost all of the cities.
Finally, I would like to draw the conclusions of this modest study, partly for scientific reasons and partly to help those, who organize the administration of regions and local authorities. I think it would be of much use to carry out such an investigation including all our cities, so that we could get a clear picture of their ranking order regarding their degree of development and supply based on measurements. The circle of indices should be extended and the supply of health-care and cultural services should be measured with a bigger variety of indices. An investigation should be made as to what other indices are needed in addition to the traditional indices used to measure the degree of development, the gathering of which could contribute to the effectiveness of regional data acquisition. The results of the investigation carried out might make it possible that, during the process of granting settlements the legal status of a city, the criteria of this process - discussed in the introductory chapter of the volume entitled The Cities of Hungary published in 1996 - could be applied with a more careful elaboration of basic information, and with the further improvement of the measuring methods, all laid down in a provision of law. This way, the influence of lobbies competing with each other to gain the legal status could also be limited.
- 200/201 -
Summary - Ranking of the Cities Recognized between 1983 and 1995 by their Grade of Development
Measuring the level of urbanization of towns has been for long a difficult task of urban statistics and urban sociology. There is no international consensus on what to call a town. In Hungary, a settlement is called a town if it is legally declared one. However, there are big differences, since some of the towns, which have been legally declared towns show only few signs of urbanization. Measuring urbanization is timely nowadays, since the number of towns has soared during the past two decades. In the early twentieth century, there were only fourteen towns in Hungary, and merely ten additional settlements were granted town status in the subsequent fifty years. By 2004, their number has leaped to 252. This dramatic rise poses the question to what extent are those new towns urbanized. To answer the question, I used a complex index for my calculations. As a first step, I calculated the intensity indices of the selected towns, what enabled me to define an "average town." This is a hypothetical town, where every index is the weighted mathematical average of the intensity indices from the towns selected. The intensity indices show the ranking of the towns along each criterion, but they are unfit for summarizing, since they are expressed with different units of measurement. In the following stage I defined the supply index of each town in the survey along each criterion in the following way: I divided the intensity index of the town concerned by the corresponding intensity index of the "average town", and then multiplied the quotient by 100 to receive the result in percentage. Finally, I calculated the complex indices of the towns in the following manner: I considered the supply indices to be a vector-coordinate, and the length of the vector (the square root from the sum of the squares of the supply indices) as being the complex index.
Let us hope that this measuring method will be incorporated into the legal process of granting town status. That could help reducing the role of lobbying in the drive for acquiring town status.
- 201/202 -
Resümee - Rangfolge der zwischen 1983 und 1995 gegründeten neuen Städte ihrem Entwicklungsgrad nach
Ein altes, immer wieder zurückkehrendes Problem der Städtestatistik und der Urbanistik ist es, wie der Entwicklungsgrad, die Verstädterung einer Stadt gemessen werden kann. Der Begriff "Stadt" wird in jedem Land anders definiert. In Ungarn werden diejenigen Siedlungen "Stadt" genannt, welche über die Rechtsstellung einer Stadt verfügen, also durch eine Rechtsbestimmung zur Stadt erklärt worden sind. Es gibt natürlich große Unterschiede, denn es gibt Städte, die verwaltungsmäßig Städte sind, aber ihre Entwicklung nur bescheidene städtische Merkmale aufweist.
Die Untersuchung des Entwicklungsgrades der Städte ist deshalb aktuell geworden, weil in den letzten zwei Jahrzehnten die Zahl der Städte plötzlich zugenommen hat. Am Anfang des 20. Jahrhunderts gab es auf dem Gebiet Ungarns insgesamt 14 Städte, und in den darauf folgenden fünfzig Jahren erhielten auch nur zehn weitere Städte den Rang einer Stadt. 2004 belief sich die Zahl der Städte schon auf 252.
Diese rasante Zunahme der Zahl von Städten wirft die Frage auf, ob und in welchem Maße diese neuen Städte städtisch sind. Um die Antwort auf diese Frage zu finden, habe ich einen komplexen Index verwendet. Ich ging vom Ausrechnen der Intensitätskennzahlen der ausgewählten Städte aus. Auf dieser Grundlage definierte ich aus den Daten der untersuchten Städte die "Durchschnittstadt". Diese ist eine theoretische Stadt, deren Kennzahlen den gewichteten mathematischen Durchschnitt der Intensitätskennzahlen der untersuchten Städte darstellen.
Die Intensitätskennzahlen zeigen uns zwar die Reihenfolge der Städte innerhalb eines Kriteriums, sie ermöglichen aber keine Summierung, weil sie mit unterschiedlichen Einheiten messen. Im nächsten Schritt legte ich die Versorgungskennzahl aller Städte bezüglich aller hinzugezogener Kriterien fest. Das geschah folgendermaßen: Ich teilte die Intensitätskennzahl durch die entsprechende Intensitätskennzahl der "Durchschnittstadt", und den Quotienten multiplizierte ich mit hundert, um das Ergebnis in Prozenten zu bekommen.
- 202/203 -
Und schließlich definierte ich die komplexen Indizes der Städte, indem ich die Versorgungskennzahlen als Koordinaten eines Vektors nahm, und die Länge dieses Vektors (die von der Quadratsumme der Versorgungskennzahlen gezogene Wurzel) betrachtete ich als den komplexen Index.
Die Ergebnisse der Untersuchung sind vielleicht geeignet, im Zuge der Erklärung einer Siedlung zur Stadt angewendet zu werden, wenn die Methoden der Messung und die Kriterien der Entwicklung in einer Rechtsnorm verankert werden. Dadurch könnte die Rolle von Interessen verschiedener Lobbies bei der Städteentwicklung eingeschränkt werden. ■
Lábjegyzetek:
[1] Department of Statistics and Legal Informatics, Telephone number: (36-1) 411-6526, e-mail: knk@ajk.elte.hu