

Sina Ardabili[1] - Amir Mosavi[2] - Csaba Makó[3] - Péter Sasvári[4]: A Comprehensive Review and Evaluation of Deep Learning Methods in the Social Sciences (Publico, 2024/1., 9-51. o.)
https://doi.org/10.32575/ppb.2024.1.2
Abstract
Artificial intelligence (AI) is widely used in social sciences and continues to evolve. Deep learning (DL) has emerged as a powerful AI tool transforming the social sciences with valuable insights across many areas. Employing DL for modelling social sciences' big data has led to significant discoveries and transformations. This study aims to systematically review and evaluate DL methods in the social sciences. Following PRISMA guideline, this study identifies fundamental DL methods applied to social science applications. We evaluated DL models using reported metrics and calculated a normalised reliability score for uniform assessment. Employing relief feature selection, we identified influential parameters affecting DL techniques' reliability. Findings suggest that evaluation criteria significantly impact DL model effectiveness, while database and application type influence moderately. Identified limitations include inadequate reporting of evaluation criteria and model structure details hindering comprehensive assessment and informed policy development. In conclusion, this review underscores DL methods' transformative role in the social sciences, emphasising the importance of explainability and responsibility.
- 9/10 -
Keywords: social science, deep learning, big data, machine learning, artificial intelligence, generative artificial intelligence
Introduction
The integration of artificial intelligence (AI) in the social sciences is expanding rapidly, profoundly shaping the field. AI equips researchers with powerful tools to analyse vast and complex social datasets with greater accuracy and efficiency. AI's application in the social sciences is becoming increasingly prevalent and transformative, offering valuable tools for analysing intricate social data. Machine learning (ML) and deep learning (DL), as the fundamental AI tools are revolutionising the social sciences, providing unprecedented opportunities for analysis and insight. This merging of technologies with social science methodologies represents a pivotal moment in research, enabling scholars to explore complex societal phenomena with enhanced depth and precision. ML and DL provide a robust toolkit for social scientists to uncover meaningful patterns and relationships from diverse datasets. This is the reason we refer to the current decade as the golden age of social sciences.[1] ML algorithms, including deep neural networks, decision trees and support vector machines, can reveal hidden structures and trends within social data, facilitating tasks like classification, prediction, and clustering. By utilising these tools, researchers can gain fresh insights into human behaviour, societal dynamics and cultural trends. DL, a subset of ML, holds particular promise in social science research due to its capacity to automatically learn hierarchical representations from data. DL techniques are increasingly applied in the social sciences to analyse large-scale textual data from social media platforms, revealing sentiment trends, identifying social networks, and understanding public discourse. Additionally, DL models can process multimodal data, integrating text, images, and videos to offer a more comprehensive understanding of social phenomena. Moreover, DL enables the integration of diverse data sources and methodologies in social science research. By merging structured data from surveys and administrative records with unstructured data from textual sources and social media, researchers can gain a holistic view of human behaviour and societal trends. Furthermore, AI-driven methods facilitate the integration of quantitative and qualitative approaches, bridging disciplinary boundaries and fostering interdisciplinary collaboration in social science inquiry. In essence, the application of DL in social sciences ushers in a new era of discovery and innovation, providing unprecedented opportunities to understand and address complex social issues. By harnessing the power of ML and DL, social scientists can advance knowledge, inform policy, and contribute to societal improvement. Social science is experiencing a golden age, marked by explosive growth in new data and analytic methods, interdisciplinary approaches, and a recognition
- 10/11 -
of their necessity in solving the world's most challenging problems. Computational social science[2] has risen in prominence over the past decade, with thousands of papers utilising observational data, experimental designs, and large-scale simulations that were once unfeasible or unavailable to researchers. These studies have significantly enhanced our understanding of social sciences.
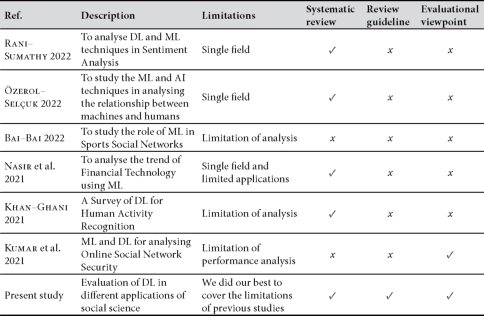
With abundant data and an increasing reliance on DL, social scientists are re-evaluating applications and best practices. Unlike traditional tasks in computer science and statistics, DL applied to social scientific data aims to discover new concepts, measure their prevalence, assess causal effects, and make predictions. The abundance of data facilitates a shift from deductive social science toward a more sequential, interactive, and ultimately inductive approach to inference. Historically, empirical work in social sciences was constrained by scarcity, where data, surveys, and computational resources were limited. However, the current landscape is defined by abundance, with big data transforming the evidence base. Social scientists are increasingly turning to deep learning methods to leverage this abundance, prioritising performance on established quantitative benchmarks. DL methods offer transformative potential in the social sciences, necessitating a re-evaluation of conventional practices. This involves reapplying deep learning techniques to gain insights into social science big data. The current abundance of data allows for a shift toward a more inductive approach, characterised by sequential and iterative inferences.[3] Using DL is crucial in social science research today. DL contributes in processing and analysing large datasets, uncovering patterns and relationships within social phenomena.[4] These technologies support evidence-based decision-making, improve prediction accuracy, and offer new perspectives on human behaviour and societal dynamics. DL is used in areas such as sentiment analysis, opinion mining, and social network analysis. Big data analytics helps to understand social trends and demographic changes, while DL allows the analysis of unstructured data like text and images. These technologies work together to enhance researchers' ability to understand and predict complex social phenomena. Reviewing the application of deep learning in social sciences can help identify successful applications, evaluate effectiveness, and highlight research gaps and opportunities. Ethical considerations are essential, ensuring responsible use of these technologies.[5] A comprehensive review provides valuable insights for policymakers, informing policies on data privacy, algorithmic transparency, and responsible implementation of deep learning. Consequently, this article provides an overview of how social scientists utilise DL methods and evaluate model performance. Several review studies on the applications of ML and DL have been conducted in various sections of the social sciences. Table 1 summarises these studies. Nevertheless, a review that is systematically following a standard guideline, which includes the evaluation of the method is missing from the literature.
- 11/12 -
Table 1: Notable DL- and ML-based review studies in the social sciences
Source: compiled by the authors
Methodology
Database preparation
The database was created using Scopus and further refined employing PRISMA guideline,[6] and Selçuk (2019) as a guideline. The search syntaxes included the terms deep learning and further deep learning general algorithms, e.g. convolutional neural network, long short-term memory, deep neural network, deep belief network, recurrent neural networks, and deep reinforcement learning, employed for social science (see Table 2). The subfield of DL and its applications in the social sciences was investigated using a comprehensive search filter. Table 2 indicates the search queries within article titles, abstracts, and keywords using AND, OR/AND operators.
- 12/13 -
Table 2: Searching queries from databases
| Search within | Operators | Keywords |
| Article title, abstract, keywords | OR | (deep learning, convolutional neural network, long short-term memory, deep neural network, deep belief network, recurrent neural networks, and deep reinforcement learning) |
| Article title, abstract, keywords | AND | (social science and the related keywords) |
Source: compiled by the authors
The PRISMA guidelines have four main phases including 1. identification phase, 2. screening phase, 3. eligibility phase and 4. inclusion. Figure 1 presents a flowchart of the PRISMA guidelines for the present research principles.
The main prospect of this review is to evaluate the DL-based techniques in the different applications of social science. The 1[st] phase of the PRISMA guidelines (Identification phase) involves identifying the required cases and building the database (Figure 1, 1[st] Phase). Accordingly, about 511 cases, 482 cases (about 94% of total cases) were exported from the WoS, and Elsevier Scopus, and 29 cases (about 6% of total cases) were exported from the other databases. Figure 2 presents the statistical trend of the records in the field per year. According to Figure 2, the trend of cases published is rising significantly. Figure 3 presents the progress of a decade of DL in social science. Figure 4 presents the geographical
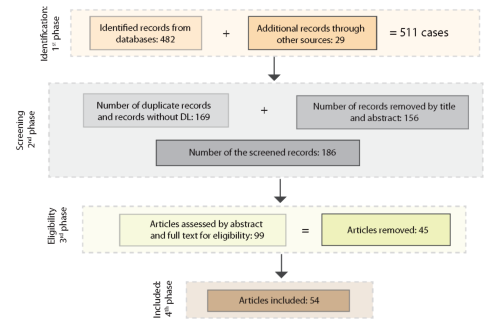
Figure 1: PRISMA guideline for preparing the database of the study
Source: compiled by the authors
- 13/14 -
distribution of the DL for social science. It is worth mentioning that social science closely interacts with various scientific and applied fields including medical, pharmaceutical and engineering fields. One of the challenges is to exclude the irrelevant studies from the database. However, in many cases due to interaction of various fields, this remains as a challenge and identified as a limitation of this study. Thus, including several irrelevant studies is inevitable.
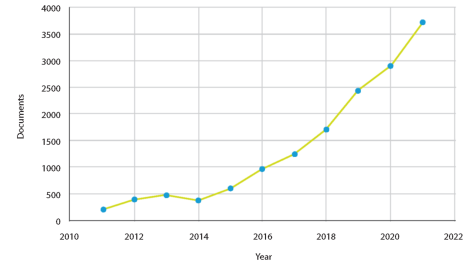
Figure 2: Progress of a decade of AI in social science
Source: compiled by the authors
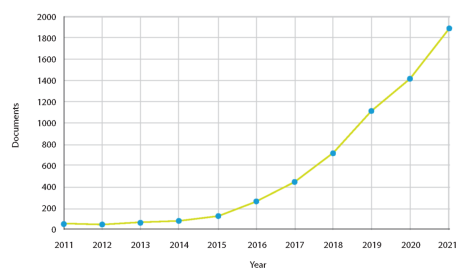
Figure 3: Progress of a decade of DL in social science
Source: compiled by the authors
- 14/15 -
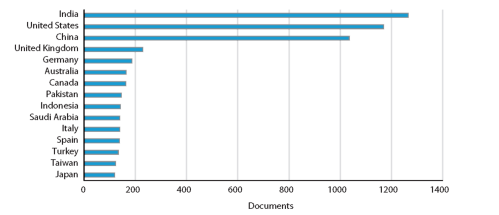
Figure 4: Geographical distribution of DL for social science
Source: compiled by the authors
In the 2[nd] phase of the PRISMA guideline, i.e. the screening phase, the duplicate cases, irrelevant cases, and cases without any information about DL are eliminated. In the 2[nd] phase, 169 cases were removed during the screening for duplication and 156 cases were removed by considering the title and abstracts. Figure 5 presents a bibliographic network based on the frequently used keywords after the first phase filtration, which were extracted as a map from bibliographic data by supporting WoS and Scopus databases.
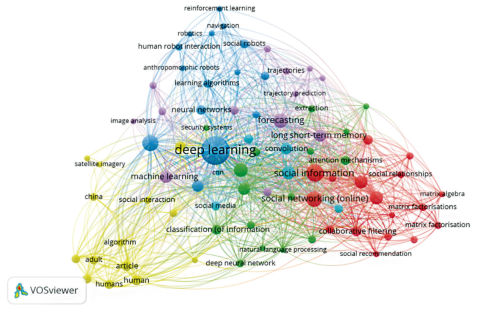
Figure 5: Bibliographic map of frequently used keywords
Source: compiled by the authors
- 15/16 -
In the following step, 186 cases were considered in the 3[rd] Phase (eligibility phase). The 3[rd] phase takes into account eligibility to filter the relevant articles. In this phase, the authors considered the full text of the cases, and the most relevant cases were chosen. Accordingly, 99 cases were selected for further evaluation. In some cases, there were limitations in accessing the full text of the records, especially in conference articles. In the last phase, 54 cases (about 11% of total cases) were selected for possible further evaluation. This "including phase" is the last step in the PRISMA guidelines. Finally, by analysing the included cases, the main taxonomy of the study was prepared. The materials studied were categorised into twelve subsets of the social sciences including social information, social network, social development, social movement, social inequalities, social cooperation, social conflict, social technology, social health, social risk, social environment, and social media (Figure 6).
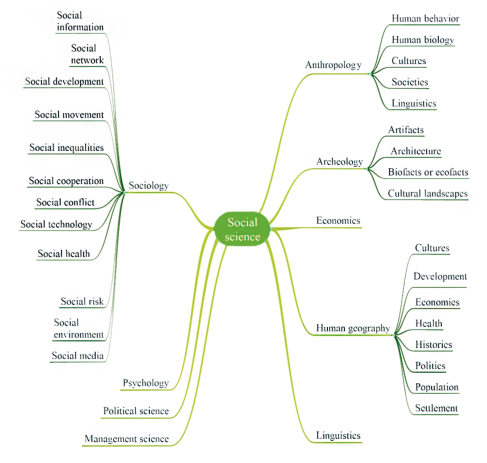
Figure 6: The subsections of social science
Source: compiled by the authors
- 16/17 -
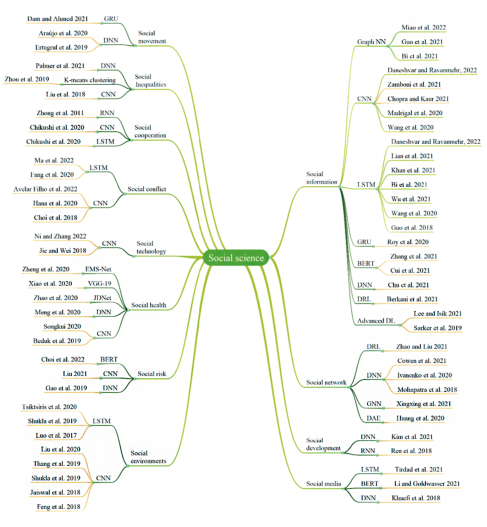
Figure 7: The main taxonomy of the study
Source: compiled by the authors
The next section presents the studies in each application of the social sciences. This section analyses the DL techniques in each section separately to highlight information along with the evaluation of the DL techniques employed (Figure 7).
- 17/18 -
Social information
Social information is one of the most frequently used keywords in the social science. Information about the notable studies that employed DL in different applications connected to social information is presented in Table 3. It has nine columns, including References, year of publication, description of the study, model characteristics, DL method type, evaluation criteria, application type, and the main keyword. This format for preparing the table description was also applied to the other fields of social science. Table 3 indicates some of the limitations of the studies that were selected. The phrase "NA" refers to non-available content.
Table 3: Notable DL-based studies for social information analysis
| Ref. | Year | Description | Model character | Method | Analysing data source | Evalua- tion criteria | Applica- tion | Keyword |
| Miao et al. 2022 | 2022 | To model collabo- rative signals | Meta-path Enhanced Light- weight | GNN | Social graphs | NA | Detection | Social recom- mendation |
| Daneshyar- Rayanmehr 2022 | 2022 | To develop a social hybrid recommen- dation platform | RSLCNet | CNN and LSTM | Data from Movie- Tweetings, Mise-en- scène, and OMDB | MAE and RMSE | Detection | Social recommendation |
| Zhang et al. 2022 | 2022 | To model factors affecting the social recommendation | NA | SoGNN | Three real-world datasets from book marking, and Last. fm | Precison | Prediction | Social recom- mendation |
| Zamboni et al. 2022 | 2022 | To develop a plat- form for the estimation of the pedestrian trajectory | NA | CNN and RNN | Public dataset | NA | Prediction | Trajectory prediction |
| Masson- Isik 2021 | 2021 | To propose social interaction perception | Fully connect- ed-kernel size | CNN | Pretrained on the ImageNet | Prediction perfor- mance score | Prediction | Social interaction perception |
| Zhang et al. 2021 | 2021 | To develop a platform for urban function recognition | Various hidden layers and nodes | BERT | Social sensing data | Kappa index and accuracy | Recogni- tion | Semantic risk |
- 18/19 -
| Ref. | Year | Description | Model character | Method | Analysing data source | Evalua- tion criteria | Applica- tion | Keyword |
| Cui et al. 2021 | 2021 | To develop an application to pro- vide automatically assistance capabil- ities of social net- work applications | NA | BERT | 38,970 sellers' infor- mation | Accuracy | Classification | Social e-com- merce |
| Chu et al. 2021 | 2021 | Cardiovascular disease prediction | NA | DNN | 834 patients from 2017 to 2020 | AUC, accu- racy, sensitivity, specificity | Prediction | Cardiovascular disease |
| Chopra- Kaur 2021 | 2021 | To develop a plat- form for IoT-based group size estima- tion | Various hidden layers and nodes | CNN | Open source soft- ware projects from github | RMSE | Prediction | Recom- mendation system |
| Khan et al. 2021 | 2021 | To evaluate the effect of depres- sion diagnosis on | NA | Bi-LSTM | Twitter database | Accuracy | Detection | Depres- sion analysis |
| Bi et al. 2021 | 2021 | To model the social recommendation system | Diffnet | GNN | Ciao and Epinions dataset | MAE and RMSE | Detection | Social recom- mendation |
| Ludl et al. 2020 | 2020 | To diagnosis of unusual human activities in urban areas | Two-layer LSTM with 32 frames | LSTM | Human movement data | Accuracy | Recogni- tion | Pose esti- mation |
| Wu et al. 2020 | 2020 | Popularity-aware content detection in a closed social network | NA | LSTM | 300 million records including 2250 web- pages spreading in | Accuracy | Prediction | Autonomous content placement |
| Cong 2020 | 2020 | A platform to pro- pose film and tele- vision culture | Fully con- nected layers: 200*64*32*32* 32*16*16*16 | CNN | User data and video data | MAE | Prediction | Personalised recommend- ation |
| Diaz et al. 2021 | 2020 | To develop a plat- form for speaker detection using social information | ResNet3D-34, ResNet3D-18 | CNN | Raw pixels (RGB images) and motion (estimated with optical flow) | AUC | Detection | Audiovisual modeling, feature fusion |
| Bai-Cheng 2020 | 2020 | To propose a multi- dimensional NN for social images classification | NA | 3DNN | RGB and depth images from social network images | Accuracy, precision and recall | Classifica- tion | Multi- modal deep learning |
Source: compiled by the authors
- 19/20 -
The main aim of the present study is to evaluate DL techniques in relation to social science, therefore, we categorised the analysis by exploring the application type and the evaluation criteria. Figure 9 presents the statistical report of the evaluation criteria. Based on Figure 8, Accuracy (about 36%) followed by AUC (about 18%) provided the highest proportion for evaluating the application of DL techniques in social information. Accuracy was employed for evaluating the Bidirectional Encoder Representations from Transformers (BERT) technique in the urban function recognition using.[7] BERT was also evaluated by the accuracy criteria for analysing the automatic assistance capabilities of social network applications.[8] Accuracy was employed for evaluating the deep neural network (DNN) for cardiovascular disease prediction.[9] The performance of the Bidirectional long-short term memory (Bi-LSTM) was evaluated by accuracy criteria to diagnose the effect of depression diagnosis on Twitter.[10] The performance of LSTM for the diagnosis of unusual human activities in urban areas was evaluated in terms of its accuracy.[11] Accuracy was employed as the criterion for evaluating LSTM in popularity-aware content detection in a closed social network.[12] Accuracy evaluated the performance of 3DNN to propose a multi-dimensional NN for social image classification.[13]
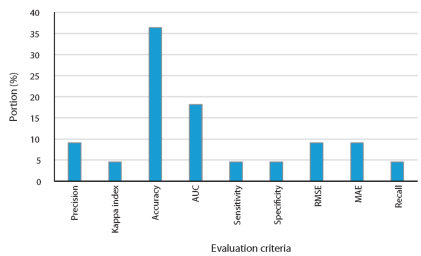
Figure 8: Statistical report of the evaluation criteria
Source: compiled by the authors
- 20/21 -
Figure 9 presents the share of each application, which employed DL in social information. Based on Figure 9, prediction (about 44%) followed by detection (about 31%) were the areas employing DL the most for social information applications. In Miao-Yang (2022), graph neural network (GNN) was employed in collaborative signals detection. In Daneshvar et al. (2022) convolutional neural network (CNN) and LSTM were employed for the detection of situations for social hybrid recommendation. In Zhang et al. (2022) some GNN techniques were employed to predict factors affecting social recommendation. In Zamboni et al. (2022) CNN and recurrent neural networks (RNN) were employed to develop a platform for the prediction of pedestrian trajectory. In Masson-Isik (2021) CNN was employed to predict social interaction perceptions. In Chopra-Kaur (2021) CNN was employed to develop a platform for IoT-based group size prediction. In Bi et al. (2021) GNN was employed to identify situations for proposing the social recommendation system.
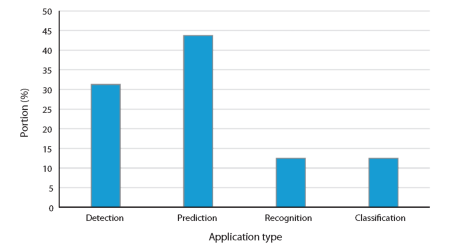
Figure 9: The statistical report of the application type
Source: compiled by the authors
Table 4 presents the evaluation results and the advantages of each DL technique in each application, separately.
- 21/22 -
Table 4: The evaluation results and the advantages of each DL technique
| Ref. | Evaluation criteria | Advantages | |||
| Miao-Yang 2022 | NA | NA | Captures reliable information | ||
| Daneshyar-Rayanmehr 2022 | NA | NA | Using DL improved the effectiveness of the model | ||
| Zhang et al. 2022 | Precision | 0.99 | The proposed technique was successfully able to cope with the task | ||
| Zamboni et al. 2022 | NA | NA | More advanced techniques were proposed | ||
| Masson-Isik 2021 | Performance score | 0.48 | Reduces the gap between the real world and the experimental approach | ||
| Zhang et al. 2021 | Kappa index | 0.61 | The model can successfully be employed to | ||
| Accuracy | 0.84 | investigate the historical POI data | |||
| Cui et al. 2021 | Accuracy | 0.9 | The method provided a real time classification | ||
| Chu et al. 2021 | AUC | 0.91 | Provides an automated detection platform for patients | ||
| Accuracy | 0.875 | ||||
| Sensitivity | 0.88 | ||||
| Specificity | 0.87 | ||||
| Chopra-Kaur 2021 | RMSE | 1.18 | Issued labels to improve the estimation performance | ||
| Khan et al. 2021 | Accuracy | 0.95 | The platform ensured the reliability of real-time depression analysis | ||
| Bi et al. 2021 | MAE | 0.71 | Provided a platform to improve the quality of recommendations | ||
| RMSE | 0.97 | ||||
| Ludl et al. 2020 | Accuracy | 0.98 | The proposed technique was successfully able to handle the task | ||
| Wu et al. 2020 | Accuracy | 0.893 | The platform enabled efficient placement decisions to be taken in a real-time task | ||
| Cong 2020 | MAE | 0.71 | The proposed technique has a suitable application effect on TV films and programs | ||
| Diaz et al. 2021 | AUC ResNet3D-34 | 0.81 | The proposed platform allowed real-time detection | ||
| AUC ResNet3D-18 | 0.79 | ||||
| Bai-Cheng 2020 | Accuracy | 0.96 | Provided valid and accurate outputs in real experiments | ||
| Precision | 0.95 | ||||
| Recall | 0.95 |
Source: compiled by the authors
According to Table 4, some of the cases did not provide evaluation criteria. There are several reasons for this. In some cases, the evaluations were performed by graphical comparisons. In some cases, the study was conducted in order to develop a system without an evaluation
- 22/23 -
step and in some cases, the full text was not available. In general, most of the cases employing DL techniques were evaluated as promising analytical tools to help address the research problem. Figure 10 presents the general evaluation of each DL in each application based on the strategy employed in our previous study.[14] We performed a relative reliability analysis by normalising accuracy, precision, and recall values (Eq. 1):

where ZN refers to the normalised reliability point, and Zmin and Zmax are the parameters (depending on the specific metric reported) employed for the limitations of the scores to provide scores between 0 and 1. For better interpretation, we further separated Z values into four categories:
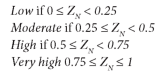
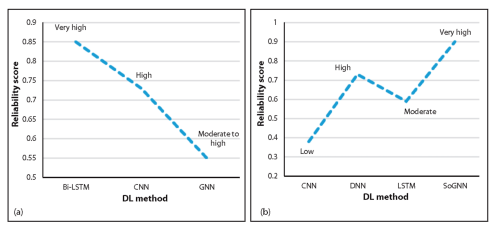
Figure 10 presents the reliability of the DL methods used in social information. The x-axis lists the DL methods, and the y-axis presents the reliability score, which is computed using Equation 1.
- 23/24 -
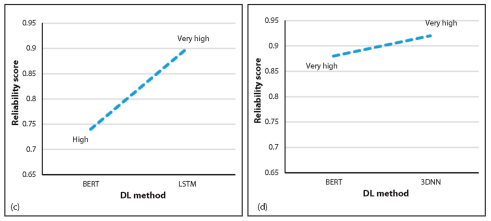
Figure 10: Reliability score for a) detection, b) prediction, c) recognition, and d) classification
Source: compiled by the authors
Bi-LSTM and LSTM displayed very high reliability scores for detection and recognition purposes, respectively, while for prediction, LSTM had a moderate reliability score. CNN achieved high reliability for detection purposes, while it exhibited a low-reliability score for prediction. GNNs achieved moderate to high reliability scores for detection purposes, while some GNNs provided very high reliability scores for prediction. BERT produced high and very high reliability scores for recognition and classification purposes, respectively. It can be observed that the reliability score depends on the application type.
Social network
Table 5 presents the information about the notable studies that employed DL in different applications connected to the topic of social networks. The nature of the content of Table 5 is similar to Table 3. Table 5 indicates some limitations of the studies developed. The phrase "NA" refers to non-available content.
- 24/25 -
Table 5: Notable DL-based studies for social network analysis
| Ref. | Year | Description | Model parameters | Method | Analysing data source | Evaluation criteria | Application | Keyword |
| Zhao-Liu 2020 | 2021 | To enhance the overall utility of vehicle drivers | Social-aware incentive mechanism | DRL | Model data | Average utility, extrinsic utility, intrinsic utility | Optimisation | Vehicular crowdsensing |
| Cowen et al. 2021 | 2021 | Investigating human facial expressions with specific social contexts in different cultures for adaptive responses to different emotions | 7 x 7 feature map comprising 1,024 channels, 7 x 7 average pooling layer, 1,024-dimensional vector | DNN | Contexts in 6 million videos from 144 countries | Accuracy and std. deviation | Classification | Human facial expressions, naturalistic social contexts |
| Xingxing et al. 2021 | 2021 | Point of interest recommendation systems | NA | GNN | Feature extraction from graphs | NA | Modeling | Point of interest, nonlinear interaction |
| Iyanenko et al. 2021 | 2021 | To classify sex and strain | NA | DNN | Recorded dataset | Accuracy | Classification | Ultrasonic vocalisations |
Source: compiled by the authors
As is clear from Table 5, in social networks, the number of studies reported, which employed DL technique is low, and this entails some limitations for analysing and evaluating the application of DL techniques in this field. According to the data presented in Table 5, classification is the main application of DL for researching social networks. For this purpose, accuracy was employed as the criterion for the evaluation of DL techniques in these applications. Zhao and Liu (2020) employed deep reinforcement learning (DRL) for optimisation and to enhance the overall utility of vehicle drivers. Cowen et al. (2021) employed DNN to classify human facial expressions with specific social contexts in different cultures for adaptive responses to different emotions. Xingxing et al. (2021) developed a recommendation system for modelling purposes using GNN. Ivanenko et al.
- 25/26 -
(2020) also developed a classification system for selecting sex and strain. Table 6 presents the numerical findings and the advantages of each model in the social network.
Table 6: The evaluation results and the advantages of each DL technique
| Ref. | Results | Advantages | |||
| Zhao-Liu 2020 | Average utility | 0.8-2 | Optimal sensing and solution strategy | ||
| Extrinsic utility | 0.8-2 | ||||
| Intrinsic utility | 0.1-1.6 | ||||
| Cowen et al. 2021 | Natural faces | 0.84 | Neutral classification in terms of region and gender | ||
| Native origin | 0.87 | ||||
| Xingxing et al. 2021 | NA | NA | Improved data sparsity and cold start in recommendations | ||
| Iyanenko et al. 2020 | Accuracy DNN | 0.77 | To achieve above-chance classification | ||
| Accuracy SVM | 0.56 | ||||
| Accuracy LR | 0.51 |
Source: compiled by the authors
By employing Equation 1, it can be concluded that DNN achieved a moderate reliability score for classification purposes. Also, for optimisation purposes regarding social network data, DRL provided a high optimisation capability.
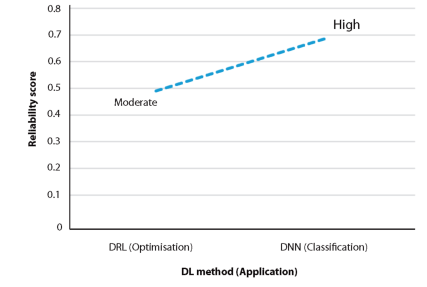
Figure 11: Reliability score for DRL and DNN
Source: compiled by the authors
- 26/27 -
Social development
Table 7 presents information about the notable studies that employed DL in different applications connected to social development. Table 7 presents the hot points of the studies developed. The phrase "NA" refers to non-available content. However, the main limitation related to this field is the lack of enough studies to investigate.
Table 7: Notable DL-based studies for social development
| Ref. | Year | Description | Model character | Method | Analysing data source | Evaluation criteria | Application | Keyword |
| Kim et al. 2021 | 2021 | To better understand biases in DL models to identify school development | ResNet18 | DNN | 3,424 satellite imagery | Accuracy | Identification | International development |
| Ren et al. 2018 | 2021 | To model the interaction between objects and model every trajectory's moving pattern | NA | RNN | NA | NA | Prediction | Human trajectory |
Source: compiled by the authors
Table 7 illustrates how studies on social networks applied DL for identification and prediction purposes. Kim et al. (2021) proposed a DNN-based technique to investigate school development. Moreover, Ren et al. (2018) presented an RNN-based modelling technique to evaluate the interaction between objects and model every trajectory's moving pattern. Table 8 presents the main results and criteria for evaluating the performance of the DL techniques. Using Equation 1, it can be observed that the reliability score of the DNN for identification purposes is evaluated as moderate.
Table 8: The evaluation results and the advantages of each DL technique
| Ref. | Results | Advantages | |
| Kim et al. 2021 | Accuracy | 0.84 | Improve the bias detection framework |
| Ren et al. 2018 | NA | NA | The proposed technique successfully copes with the task |
Source: compiled by the authors
- 27/28 -
Social media
Table 9 presents the notable DL-based studies on the subject of social media. As Table 9 shows, DL in social media has been employed for detection,[15] recognition,[16] and prediction[17] purposes.
Table 9: Notable DL-based studies for social media
| Ref. | Year | Description | Model character | Method | Analysing data source | Evaluation criteria | Application | Keyword |
| Tirdad et al. 2021 | 2021 | For sentiment analysis of medically related texts | Filter size 205 for LSTM | CNN, LSTM, BLSTM | Concussion tweets - 2018 dataset | F1-score, precision, recall | Detection | Sentiment analysis, concussion |
| Li-Goldwasser 2021 | 2021 | To analyse the text model using signals from the rich social and linguistic context | Stopping patience is equal to 10 | Bidirectional encoder nsformers | Allsides and SemEval news dataset | Accuracy | Recognition | Political perspective |
| Khaefi et al. 2018 | 2018 | To forecast air quality | VGG-16 | CNN | Photos shared on social media | Accuracy | Prediction | Haze severity inference |
Source: compiled by the authors
To evaluate the use of DL in social media, we employed data presented in Table 10 and calculated the reliability score by Equation 1. Figure 12 presents the reliability scores.
- 28/29 -
Table 10: The evaluation results and the advantages of each DL technique
| Ref. | Results | Advantages | |
| Tirdad et al. 2021 | CNN F1-score | 0.621 | Provides an understanding of the culture around concussion through sentiment analysis |
| CNN Accuracy | 0.617 | ||
| LSTM F1-score | 0.613 | ||
| LSTM Accuracy | 0.612 | ||
| BLSTM F1-score | 0.607 | ||
| BLSTM Accuracy | 0.622 | ||
| Ll-GOLDWASSER 2021 | CNN Accuracy | 0.84 | Pre-training provided an effective improvement in the accuracy of the model |
| BERT Accuracy | 0.84 | ||
| Ensemble Accuracy | 0.86 | ||
| Khaefi et al. 2018 | Accuracy | 0.8724 | Using social media datasets improves real-time forecasting of property |
Source: compiled by the authors
Figure 12 illustrates that the reliability score of CNN for detection is evaluated as moderate but for prediction, CNN achieved a very high score. For recognition purposes, the Ensemble technique produced a very high score, while BERT and CNN provided High scores. In detection, BLSTM improved reliability in comparison with LSTM and CNN with a score from Moderate to High. In general, it appears that the reliability score of prediction and recognition applications is higher than the score for detection applications.
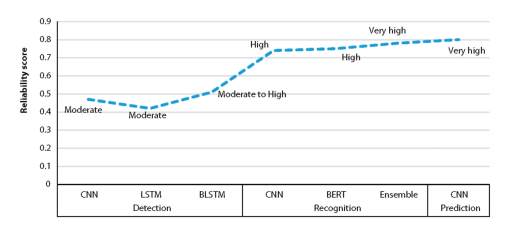
Figure 12: The reliability score
Source: compiled by the authors
- 29/30 -
Social environments
Table 11 presents the notable DL-based studies on social environments. Figure 13 presents the statistical report on the share of applications of DL. As can be seen in Figure 13, Detection represented the highest proportion (30%) in comparison with other applications. It can be asserted that, in the field of social environment, detection is the main problem that required DL-based techniques. Figure 13 presents the statistical report on the evaluation criteria employed in the social environment.
Table 11: Notable DL-based studies for social environments
| Ref. | Year | Description | Model character | Method | Analysing data source | Evaluation criteria | Application | Keyword |
| Tsiktsiris et al. 2020 | 2020 | Real-time abnormal event for security improvement | NA | LSTM | 3 hidden layers, size (32 x 64), the rectified linear unit (ReLU) activation function | Accuracy, F1-score, recall and precision | Detection | Crimes detection |
| Liu-Zhang 2020 | 2019 | To evaluate mental health courses | NA | CNN, DBN | Data from colleges and universities | NA | Optimisation | Evaluation feedback |
| Shukla et al. 2019 | 2019 | Sharing a common house space with humans | Four-layered convolutional with batch normalisation activation ELU | RNN- lstm, CNN | Combination of public datasets | Accuracy, F1-score, recall and precision | Recognition | Humanoid robots |
| Thang et al. 2018 | 2019 | Source location and type classification of noise | SB-CNN, VGG-16, VGG-16-PRE | CNN | SNU-B36-50 | Accuracy | Classification | Noise between floors |
- 30/31 -
| Ref. | Year | Description | Model character | Method | Analysing data source | Evaluation criteria | Application | Keyword |
| Feng et al. 2018 | 2018 | To recognise multistage and elastic spam in social media | Convolutional layer of 128 word vector with Max-over-time Pooling method | CNN | Sina Weibo dataset | Accuracy | Detection | Mobile social networks |
| Jaiswal et al. 2018 | 2018 | To evaluate the command direction by a finger pointing gesture | Kernel size from 3 x 3 to 5 x 5 in each of the units with rectified linear unit (ReLU) activation function | CNN | 24,000 images | MSE | Estimation | Gesture based communication |
| Luo-Hsieh 2017 | 2017 | To evaluate situational context perception | The first convolutional layer convolves 32 filters of 5 x 5 with stride 1 followed by rectifier linear unit (ReLU) | LSTM | Real-world image data | Accuracy | Detection | Human social environments |
Source: compiled by the authors
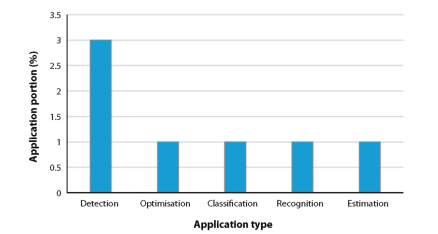
Figure 13: The statistical report of the application type
Source: compiled by the authors
- 31/32 -
Figure 14 presents evidence supporting the claim that the Accuracy criteria is the most frequently used evaluation criteria for the application of DL in Social environments. Table 12 presents the main findings and advantages of the proposed methods and procedures for each study, separately.
Table 12: The evaluation results and the advantages of each DL technique
| Ref. | Results | Advantages | |
| TSIKTSIRIS et al. 2020 | Accuracy | 0.996 | The proposed method improved timely detection of petty crimes incidents |
| Precision | 0.98 | ||
| Recall | 0.98 | ||
| F1-score | 0.98 | ||
| Liu-Zhang 2020 | NA | NA | Continuously explore in the shallow information |
| Shukla et al. 2019 | Gesture accuracy | 0.98 | The proposed technique provided real-time detection capability |
| Speech accuracy | 0.913 | ||
| Thang et al. 2018 | SB-CNN | 0.674 | Pre-training provides a higher classification performance |
| VGG-16 | 0.707 | ||
| VGG-16- PREtrained | 0.96 | ||
| Feng et al. 2018 | Accuracy | 0.913 | The proposed platform improved the utilisation rate of computing resources and realised real-time application |
| JAISWAL et al. 2018 | MSE | < 0.0001 | The proposed technique was able to implement humanoid robots in real time |
| Luo-Hsieh 2017 | Encoded image + HOG | 0.947 | The proposed platform improved the identification of assistance via taking spatio-temporal factor into consideration |
| Encoded image + optical flow | 0.887 | ||
| Optical flow + HOG | 0.981 |
Source: compiled by the authors
Accordingly, Figure 15 was prepared to present the reliability score (calculated from Equation 1). Based on Figure 15, it can be stated that CNN plays different roles for different applications. CNN achieved a very high reliability score for detection, while exhibiting moderate and high scores for estimation and classification purposes. Also, RNN-LSTM achieved very high reliability scores for recognition and LSTM for detection purposes.
- 32/33 -
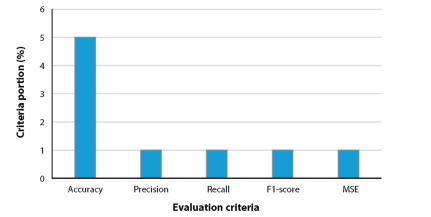
Figure 14: Statistical report of the evaluation criteria
Source: compiled by the authors
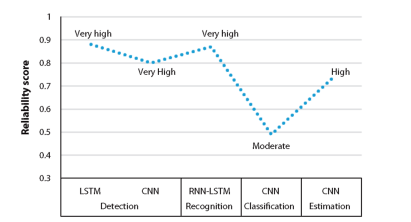
Figure 15: The reliability score
Source: compiled by the authors
Social risk
Table 13 presents several notable DL-based studies on social risk applications. As reported in Table 13, DL has been employed for detection, prediction, and forecasting purposes of the social risk. Choi et al. (2022) employed BERT to "claim a sentence of a rumor" [sic] using 7,403 claims from fact-checking sites and evaluated the model using the area under the curve (AUC) and accuracy criteria. Liu (2021) employed a classification and regression
- 33/34 -
tree (CART) and CNN to forecast risk information of the community in the presence of the community public information. The evaluations were performed by correlation coefficient and mean square error (MSE) values. Gao et al. (2019) employed spatial incomplete multitask deep learning to predict Spatio-Temporal Event Subtype and evaluated the model by AUC factor. In general, it can be said that accuracy and AUC have been frequently used for the evaluation of DL techniques in social risk.
Table 13: Notable DL-based studies for social risk
| Ref. | Year | Description | Model character | Method | Analysing data source | Evaluation criteria | Application | Keyword |
| Choi et al. 2022 | 2022 | "To claim sentence of a rumor" [sic] | Twelve fully connected layers | BERT | 7,403 claims from fact-checking sites | AUC and accuracy | Detection | Rumor spread |
| Liu 2021 | 2021 | To forecast risk information of the community | NA | CART and CNN | Community public information | CC, MSE | Prediction | Public service information |
| Gao et al. 2019 | 2019 | To predict Spatio-Temporal Event Subtype | The hidden representation learned by the shared hidden layers | Spatial Incomplete Multi-task Deep learning (SIMDL) | NA | AUC | Forecasting | Subtypes |
Source: compiled by the authors
Table 14 presents the evaluation results and the advantages of each DL technique. Figure 16 shows the reliability score calculated by Equation 1.
Table 14: The evaluation results and the advantages of each DL technique
| Ref. | Results | Advantages | |
| Choi et al. 2022 | AUC | 0.7 | The pre-trained model can successfully deal with a wide range of applications |
| Accuracy | 0.72 | ||
| Liu 2021 | CC, CART | 0.862 | DL provided better system reliability |
| MSE, CART | 0.743 | ||
| CC, CNN | 0.925 | ||
| MSE, CNN | 0.855 | ||
| Gao et al. 2019 | AUC | 0.81 | The proposed technique has been successfully coped with the task |
Source: compiled by the authors
- 34/35 -
According to Figure 16, CNN for prediction achieved a very high reliability score, while CART provided high reliability for prediction. Furthermore, SIMDL provided high reliability for forecasting applications. Moderate reliability was achieved by BERT for detection purposes.
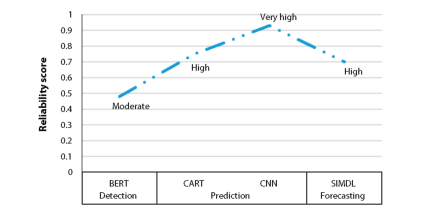
Figure 16: The reliability score
Source: compiled by the authors
Social health
Table 15 presents the notable DL-based studies on topics relating to social health. Figure 17 presents information about the evaluation criteria employed for evaluating DL techniques when applied in investigations relating to social health.
Table 15: Notable DL-based studies for social health
| Ref. | Year | Description | Model character | Method | Analysing data source | Evaluation criteria | Application | Keyword |
| Zheng et al. 2019 | 2020 | To handle the clinical assessment and treatment planning | Local features alone and global features alone | CNN | 300 ms background activity | Accuracy, precision, sensitivity, specificity, AUC, F1-score | Detection | Spike detection |
- 35/36 -
| Ref. | Year | Description | Model character | Method | Analysing data source | Evaluation criteria | Application | Keyword |
| Xiao et al. 2020 | 2020 | To recognise workers' wearing masks | VGG-19 | CNN | 3,000 mask images | Precision and recall | Detection | Wearing masks |
| Zhao et al. 2020 | 2020 | To develop a visual food recognition platform | JDNet | CNN | UECFood256 and Food-101 datasets | Accuracy | Recognition | Mobile visual food |
| Meng et al. 2020 | 2020 | To evaluate the physical and mental health of the elderly | NA | DNN | Street view images | Accuracy | Detection | Elderly health |
Source: compiled by the authors
Figure 17 indicates accuracy provided the highest application portion (about 42%) for evaluating the DL in social health.
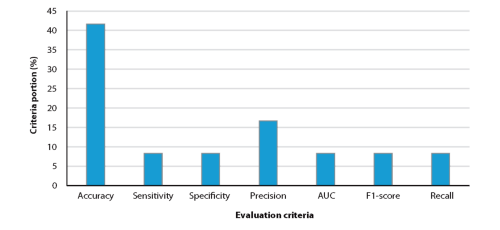
Figure 17: Statistical report of the evaluation criteria
Source: compiled by the authors
- 36/37 -
Table 16 presents the results and advantages of DL techniques used in studies on social health. Figure 17 was prepared by calculating the reliability score using Equation 1.
Table 16: The evaluation results and the advantages of each DL technique
| Ref. | Results | Advantages | |
| Zheng et al. 2019 | Accuracy Precision Sensitivity Specificity AUC F1-score | 0.99 0.99 0.99 0.99 0.99 0.99 | General representation of epileptic spikes was successfully identified using the DL technique |
| Xiao et al. 2020 | Precision | 0.97 | The proposed technique provided a considerable improvement in reliability |
| Recall | 0.96 | ||
| Zhao et al. 2020 | Accuracy UECfood | 0.84 | The proposed technique achieved high food recognition performance on mobile platforms |
| Accuracy Food-101 | 0.91 | ||
| Meng et al. 2020 | Accuracy | 0.84 | The obtained results provided practical significance for city managers and designers |
Source: compiled by the authors
According to Figure 17, CNN provided very high reliability for detection purposes while CNN provided high reliability for recognition. In addition, DNN attained moderate and high reliability for detection and estimation purposes.
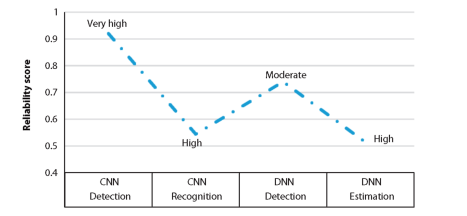
Figure 18: The reliability score
Source: compiled by the authors
- 37/38 -
Social conflict
Table 17 presents notable DL-based studies related to social conflict. Ma et al. (2022) employed LSTM to estimate pedestrians' trajectories to model crowds hierarchically. The evaluations were conducted by graphical analysis. Hana et al. (2020) employed CNN for the classification of the hate data in a database of Twitter posts. Choi et al. (2018) employed a pre-trained CNN technique to propose a classification platform. According to the analytical results, accuracy is the most frequently used evaluation criteria for evaluating DL in social conflict.
Table 17: Notable DL-based studies for social conflict
| Ref. | Year | Description | Model character | Method | Analysing data source | Evaluation criteria | Application |
| Ma et al. 2022 | 2020 | A conflict-avoiding technique to estimate pedestrians' trajectories to model a crowd hierarchically | RNN | LSTM | BIWI and UCY public dataset | Graphical analysis | Prediction |
| Hana et al. 2020 | 2020 | To classify the hate speech in social media | 6 layers, 768 hidden, 12 heads, and 134M parameters | CNN | Tweeter data | Accuracy | Classfication |
| Choi et al. 2018 | 2018 | To propose a classification platform | VGG-16-PRE | Pretrained CNN | SNU-B36-50 dataset | Accuracy | Classfication |
Source: compiled by the authors
Table 18 presents the results and advantages of the DL techniques employed. It is clear, however, that there is a lack of the evaluation criteria for further analysis. This can be considered the main limitation of DL-based studies on social conflict. By calculating the reliability score (using Equation 1), it can be said that CNN and pre-trained CNN provided significant differences in reliability scores (high and very high reliability scores, respectively) for detection purposes.
- 38/39 -
Table 18: The evaluation results and the advantages of each DL technique
| Ref. | Results | Advantages | |
| Ma et al. 2022 | NA | NA | Same time prediction of the span using a shorter observation period |
| Hana et al. 2020 | Accuracy | 0.64 | CNN provided a low accuracy rate |
| Choi et al. 2018 | Accuracy | 0.96 | Pre-training is a promising technique |
Source: compiled by the authors
Social inequalities
Table 19 presents the notable DL-based studies on the topic of social inequality analysis. Palmer et al. (2021) employed CNN to automatically extract and classify unhealthy advertisements. The evaluations were conducted by referring to the precision, recall, and F1-score. Zhou et al. (2019) employed deep convolutional encoder-decoder to provide a framework for understanding street visual walkability. The evaluation was conducted by accuracy criteria.
Table 19: Notable DL-based studies for social inequalities
| Ref. | Year | Description | Model character | Method | Analysing data source | Evaluation criteria | Application | Keyword |
| Palmer et al. 2021 | 2021 | To automatically extract and classify unhealthy advertisements | Stochastic gradient descent to implement complex functions | CNN | Street-level images collected | Precision, recall and F1- score | Classification | Unhealthy advertisements |
| Zhou et al. 2019 | 2019 | To provide a framework for understanding street visual walkability | SegNet | Deep con- volutional encoder- decoder | Images with corresponding ground | Accuracy | Detection | Visual walkability |
Source: compiled by the authors
Table 20 presents the evaluation metrics and advantages of the models. Accordingly, the reliability score was calculated by Equation 1 and presented in Figure 18.
- 39/40 -
Table 20: The evaluation results and the advantages of each DL technique
| Ref. | Results | Advantages | |
| Palmer et al. 2021 | Precision | 0.662 | The platform provided identification areas for tackling - social inequalities |
| Recall | 0.787 | ||
| F1-score | 0.718 | ||
| Zhou et al. 2019 | Accuracy | 0.785 | The proposed platform can be extended to other unfeasible or challenging cases |
Source: compiled by the authors
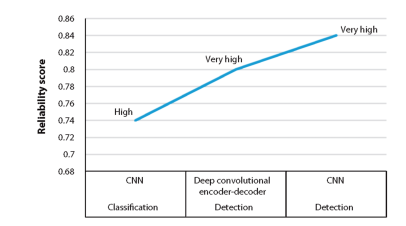
Figure 19: The reliability score
Source: compiled by the authors
According to Figure 19, CNN achieved very high and high reliability scores for Detection and Classification purposes, respectively. Moreover, the deep convolutional encoderdecoder achieved a very high reliability score for Detection purposes.
Other applications
We created a section entitled other applications for those applications, which do not include Social cooperation, Social movement, and Social technology. A limitation of these applications is that there is an insufficient number of such studies and analytical evaluation metrics. In addition, there was a lack of the analytical datasets for analysing Social cooperation, Social movement, and Social technology applications. These limitations hinder the evaluation prospects for these studies and make statistical analysis difficult. This is one of the main disadvantages of the following applications, and is known to be their main limitation. Limited studies have been performed on these applications. Ni and Zhang (2022) employed multi-graph gated graph convolution to develop a platform
- 40/41 -
for spatial-temporal traffic flow prediction. Zhang (2018) proposed a platform of highly intelligent robots using the CNN technique. Dam and Turzo (2021) employed GRU-RNN for handling a Bangla social media dataset to estimate social movements. Ertugrul et al. (2019) employed LSTM to explore protest events along with the social and geographical contexts. Zhang and Pan (2019) employed CNN for image data and LSTM-RNN for text data to investigate social media activities. In these cases, the lack of enough information in the dataset presented or in analytical results or model description prevented us from obtaining sufficient information to categorise and present reliability scores for evaluating the DL techniques employed in the studies.
Discussion
For evaluating DL methods, it is often essential to review a series of parameters, metrics and criteria provided in the results section of each article. Some articles used evaluation and comparative parameters for assessment. Others used visual and graphic methods to examine and compare DL methods. However, the success rate of these parameters in evaluating deep learning methods in different applications is a general and important question. This study seeks to fill this gap in the evaluation of DL methods by employing the most innovative methods possible. The performance of different methods in different applications was in the focus of the previous sections. However, it is also important to consider whether the presented method is able to provide useful results when applied to all databases, and this reliability must be independent of the database type. With this aim in mind, we used a feature selection method in order to select the most effective parameter in determining the accuracy and performance of a network and, based on this, to determine the most suitable policy for future study. In this technique, we employed the Relief feature selection method to choose the most effective parameters for DL evaluation from each study separately. Accordingly, we emphasised y = f(x1,x2,x3) where y refers to the DL reliability score, x1 refers to the evaluation criteria, x2 refers to the database dimension and the number of the dataset, input variable, and output variables and x3 refers to the application type. This technique may allow us to find the most effective variables related to DL performance in order to formulate the policies based on the selected variable. The use of this technique is the first time that has been employed in the present study for evaluating the DL techniques applied in the social sciences. This method considers a data set with n samples with properties of p. The algorithm starts with a weight vector (W) zero and is repeated m times. Each iteration considers the attribute vector (X) belonging to a random instance, and next to that, the attribute vector indicates the instance closest to X. Based on this, the parameters of the closest instance of the same class are near-hit and the nearest instance of the different class is near-miss.[18] Equation 2 shows the weight vector:
- 41/42 -

Accordingly, the weight of properties close to the class increases and decreases in reverse. After m is repeated, each weight vector element is normalised to m. This is called the vector of a relation vector. Relief can also be described as generalisable to polynomial classification by breaking down several binary problems.[19] The relief feature selection technique was applied by Python software. Table 21 presents the output of the relief feature selection for choosing the best factor affecting the reliability score of DL methods in social science.
Table 21: The results of relief feature selection technique
| Ref. | Evaluation criteria | Database | Application | Ref. | Evaluation criteria | Database | Application |
| Cowen et al. 2021 | ** | * | * | Zamboni et al. 2022 | NA | ** | ** |
| Xingxing et al. 2021 | NA | ** | * | Masson-Isik 2021 | *** | ** | * |
| Ivanenko et al. 2020 | ** | * | *** | Zheng et al. 2019 | ** | ** | ** |
| Kim et al. 2021 | *** | * | * | Cui et al. 2021 | ** | * | * |
| Ren et al. 2018 | NA | ** | ** | Chu et al. 2021 | *** | ** | ** |
| Tirdad et al. 2021 | *** | ** | * | Chopra-Kaur 2021 | *** | ** | ** |
| Li-Goldwasser 2021 | *** | ** | ** | Khan et al. 2021 | *** | ** | * |
| Khaefi et al. 2018 | ** | ** | ** | Bi et al. 2021 | *** | ** | ** |
| Tsiktsiris et al. 2020 | * | ** | * | Ludl et al. 2020 | *** | ** | ** |
| Liu-Zhang 2020 | NA | ** | * | Wu et al. 2020 | ** | * | ** |
| Shukla et al. 2019 | ** | ** | * | Cong 2020 | ** | * | ** |
| Thang et al. 2018 | *** | * | * | Diaz et al. 2021 | *** | *** | ** |
| Feng et al. 2018 | ** | ** | * | Miao et al. 2022 | *** | * | * |
| Jaiswal et al. 2018 | *** | * | ** | Daneshvar- Ravanmehr 2022 | *** | ** | * |
| Luo-Hsieh 2017 | ** | * | * | Zhang et al. 2022 | *** | ** | ** |
| Choi et al. 2022 | ** | * | * | Ma et al. 2022 | *** | ** | * |
| Gao et al. 2019. | ** | ** | * | Hana et al. 2020 | *** | *** | ** |
| Zheng et al. 2019 | *** | *** | * | Choi et al. 2018 | *** | ** | ** |
| Xiao et al. 2020 | ** | *** | ** | Chikushi et al. 2020 | *** | ** | ** |
| Zhao et al. 2020 | *** | ** | ** | Palmer et al. 2021 | *** | * | * |
| Meng et al. 2020 | *** | * | * | Zhou et al. 2019 | *** | ** | ** |
| Total score | Very High | Moderate | Moderate |
Source: compiled by the authors
- 42/43 -
The results presented in Table 21 suggest that the most effective parameter of DL reliability is the evaluation criteria. The effect of database and application type is moderate. Accordingly, it can be considered that the best criteria for evaluating the DL techniques are evaluation criteria values. Based on this conclusion, some limitations can be identified in the studies that were surveyed. One of their main limitations is the lack of reporting evaluation criteria values in the evaluation phase. Some studies did not calculate these parameters to examine the model employed. Other limitations include the lack of reporting on the structure and architecture of the models and networks used by some of the studies, which deviate from the descriptive nature of the model and which do not allow the researcher to recommend policies based on these models. Also, some articles failed to provide the studied data and its sources, which can be a deterrent to further studies. This requires a proper policy when selecting and preparing the articles that employed ML and DL techniques for different applications, in order to prevent similar limitations in future.
Conclusions
This study reviews and presents the performance of DL methods in the social sciences. It finds that accuracy and AUC are the key metrics for evaluating DL techniques in social information. LSTM is reliable for detection and recognition and also popular for prediction. In social networks, the limited number of studies expressed the evaluation, with DNN being moderately reliable for classification and DRL capable for optimisation. Social media analysis rates CNN as moderately reliable for detection and very high for prediction, with Ensemble techniques, BERT, and CNN scoring high for recognition. In the social environment, CNN is very reliable for detection and moderately to highly reliable for estimation and classification. For social risk, CNN shows very high prediction reliability, and CART shows high reliability. In social health, CNN is very reliable for detection and recognition, while DNN is moderately to highly reliable for detection and estimation. In social conflict, evaluation criteria are lacking, limiting analysis, but CNN and pre-trained CNN show high to very high reliability for detection. For social inequalities, CNN scores very high for detection and high for classification, with deep convolutional encoderdecoder also scoring very high for detection. Other applications face limitations due to insufficient studies and metrics for comparison. The review emphasises the importance of transparent evaluation criteria, model structure, and architecture to ensure reproducibility and advancement of DL research in social sciences.
References
Al-Sartawi, Abdalmuttaleb M. A. Musleh ed. (2021): Big Data-Driven Digital Economy: Artificial and Computational Intelligence. Springer. Online: https://doi.org/10.1007/978-3-030-73057-4
- 43/44 -
Bai, Junwei - Cheng, Chi (2020): A Social Network Image Classification Algorithm Based on Multimodal Deep Learning. International Journal Computers Communications and Control, 15(6). Online: https://doi.org/10.15837/ijccc.2020.6.4037
Bai, Zhongbo - Bai, Xiaomei (2022): Towards Understanding the Analysis, Models, and Future Directions of Sports Social Networks. Complexity, 5743825. Online: https://doi.org/10.1155/2022/5743 825
Band, Shahab S. - Ardabili, Sina - Sookhak, Mehdi - Chronopoulos, Anthony T. - Elnaffar, Said - Moslehpour, Massoud et al. (2022): When Smart Cities Get Smarter via Machine Learning: An In-Depth Literature Review. IEEE Access, 10, 60985-61015. Online: https://doi.org/10.1109/ACCESS.2022.3181718
Buyalskaya, Anastasia - Gallo, Marcos - Camerer, Colin F. (2021): The Golden Age of Social Science. Proceedings of the National Academy of Sciences, 118(5). Online: https://doi.org/10.1073/pnas.2002923118
Bi, Zhongpin - Jing, Lina - Shan, Meijing - Dou, Shuming - Wang, Shiyang (2021): Hierarchical Social Recommendation Model Based on a Graph Neural Network. Wireless Communications and Mobile Computing, 2021. Online: https://doi.org/10.1155/2021/9107718
Choi, Daejin - Oh, Hyuncheol - Chun, Selin - Kwon, Taekyoung - Han, Jinyoung (2022): Preventing Rumor Spread with Deep Learning. Expert Systems with Applications, 197, 116688. Online: https://doi.org/10.1016/j.eswa.2022.116688
Choi, Hwiyong et al. (2018): Classification of Noise between Floors in a Building Using Pre-Trained Deep Convolutional Neural Networks. In 2018 16[th] International Workshop on Acoustic Signal Enhancement (IWAENC). IEEE. Online: https://ieeexplore.ieee.org/stamp/stamp.jsp?tp=&arnumber=8521392
Chopra, Deepti - Kaur, Arvinder (2021): IoT-based Group Size Prediction and Recommendation System Using Machine Learning and Deep Learning Techniques. Discover Applied Sciences, 3(2), 1-18. Online: https://doi.org/10.1007/s42452-021-04162-x
Chu, Haiyun - Chen, Lu - Yang, Xiuxian - Qiu, Xiaohui - Qiao, Zhengxue - Song, Xuejia et al. (2021): Roles of Anxiety and Depression in Predicting Cardiovascular Disease among Patients with Type 2 Diabetes Mellitus: A Machine Learning Approach. Frontiers in Psychology, 12, 1189. Online: https://doi.org/10.3389/fpsyg.2021.645418
Chikushi, Shota - Kasahara, Jun Younes Louhi - Fujii, Hiromitsu - Tamura, Yusuke - Faragasso, Angela - Yamakawa, Hiroshi et al. (2020): Research and Development of Construction Technology in Social Cooperation Program "Intelligent Construction System". In ISARC. Proceedings of the International Symposium on Automation and Robotics in Construction. IAARC Publications, 1536-1540. Online: https://doi.org/10.22260/ISARC2020/0213
Cong, Hongyan (2020): Personalized Recommendation of Film and Television Culture Based on an Intelligent Classification Algorithm. Personal and Ubiquitous Computing, 24(2), 165-176. Online: https://doi.org/10.1007/s00779-019-01271-8
- 44/45 -
Cowen, Alan S. - Keltner, Dacher - Schroff, Florian - Jo, Brendan - Adam, Hartwig - Prasad, Gautam (2021): Sixteen Facial Expressions Occur in Similar Contexts Worldwide. Nature, 589(7841), 251-257. Online: https://doi.org/10.1038/s41586-020-3037-7
Cui, Haoliang - Shao, Shuai - Niu, Shaozhang - Shi, Chengjie - Zhou, Lingyu (2021): A Classification Method for Social Information of Sellers on Social Network. EURASIP Journal on Image and Video Processing, 2021(1), 1-12. Online: https://doi.org/10.1186/s13640-020-00545-z
Dam, Sumit Kumar - Turzo, Tausif Ahmed (2021): Social Movement Prediction from Bangla Social Media Data Using Gated Recurrent Unit Neural Network. In 2021 5[th] International Conference on Electrical Information and Communication Technology (EICT). IEEE. Online: https://doi.org/10.1109/EICT54103.2021.9733681
Daneshvar, Hirad - Ravanmehr, Reza (2022): A Social Hybrid Recommendation System Using LSTM and CNN. Concurrency and Computation. Practice and Experience, 34(18), e7015. Online: https://doi.org/10.1002/cpe.7015
Diaz, Jorge Francisco Madrigal - Lerasle, Frédéric - Pibre, Lionel - Ferrane, Isabelle (2021): Audio-Video Detection of the Active Speaker in Meetings. In IEEE 25[th] International Conference on Pattern Recognition (ICPR 2020). Online: https://hal.science/hal-03125600/file/ICPR.pdf
Ertugrul, Ali Mert - Lin, Yu-Ru - Chung, Wen-Ting - Yan, Muheng - Li, Ang (2019): Activism via Attention: Interpretable Spatiotemporal Learning to Forecast Protest Activities. EPJData Science, 8(1), 5. Online: https://doi.org/10.1140/epjds/s13688-019-0183-y
Feng, Bo - Fu, Qiang - Dong, Mianxiong - Guo, Dong - Li, Qiang (2018): Multistage and Elastic Spam Detection in Mobile Social Networks through Deep Learning. IEEE Network, 32(4), 15-21. Online: https://doi.org/10.1109/MNET.2018.1700406
Galesic, Mirta - Bruine de Bruin, Wändi - Dalege, Jonas - Feld, Scott L. - Kreuter, Frauke - Olsson, Henrik - Prelec, Drazen - Stein, Daniel L. - Does, Tamara van der (2021): Human Social Sensing is an Untapped Resource for Computational Social Science. Nature, 595(7866), 214-222. Online: https://doi.org/10.1038/s41586-021-03649-2
Gao, Yuyang - Zhao, Liang - Wu, Lingfei - Ye, Yanfang - Xiong, Hui - Yang, Chaowei (2019): Incomplete Label Multi-Task Deep Learning for Spatio-Temporal Event Subtype Forecasting. Proceedings of the AAAI Conference on Artificial Intelligence, 33(1), 3638-3646. Online: https://doi.org/10.1609/aaai.v33i01.33013638
Grimmer, Justin - Roberts, Margaret E. - Stewart, Brandon M. (2021): Machine learning for social science: An agnostic approach. Annual Review of Political Science, 24, 395-419. Online: https://doi.org/10.1146/annurev-polisci-053119-015921
Goodfellow, Ian et al. (2016): Deep Learning. MIT Press. Online: www.deeplearningbook.org
- 45/46 -
Hana, Karimah Mutisari - Adiwijaya - Al Faraby, Said - Bramantoro, Arif (2020) : Multi-Label Classification of Indonesian Hate Speech on Twitter Using Support Vector Machines. In 2020 International Conference on Data Science and Its Applications (ICoDSA). IEEE. Online: https://ieeexplore.ieee.org/stamp/stamp.jsp?tp=&arnumber=9212992
Hicks, Diana (2004): The Four Literatures of Social Science. In Moed, Henk F. - Glänzel, Wolfgang - Schmoch, Ulrich (eds.): Handbook of Quantitative Science and Technology Research. Dordrecht: Springer, 473-496. Online: https://doi.org/10.1007/1-4020-2755-9
Hofman, Jake M. - Watts, Duncan J. - Athey, Susan - Garip, Filiz - Griffiths, Thomas L. - Kleinberg, Jon - Margetts, Helen - Mullainathan, Sendhil -Salganik, Matthew J. - Vazire, Simine - Vespignani, Alessandro - Yarkoni, Tal (2021) : Integrating Explanation and Prediction in Computational Social Science. Nature, 595(7866), 181-188. Online: https://doi.org/10.1038/s41586-021-03659-0
Ivanenko, Alexander - Watkins, P. - van Gerven, M. A. J. - Hammerschmidt, K. -Englitz, B. (2020): Classifying Sex and Strain from Mouse Ultrasonic Vocalizations Using Deep Learning. PLOS Computational Biology, 16(6), e1007918. Online: https://doi.org/10.1371/journal.pcbi.1007918
Jaiswal, Shruti - Mishra, Pratyush - Nandi, G. C. (2018): Deep Learning Based Command Pointing Direction Estimation Using a Single RGB Camera. In 2018 5[th] IEEE Uttar Pradesh Section International Conference on Electrical, Electronics and Computer Engineering (UPCON). IEEE. Online: https://ieeexplore.ieee.org/stamp/stamp.jsp?tp=&arnumber=8596762
Khaefi, Muhammad Rizal - Pramestri, Zakiya - Amin, Imaduddin - Lee, Jong Gun (2018): Nowcasting Air Quality by Fusing Insights from Meteorological Data, Satellite Imagery and Social Media Images Using Deep Learning. In 2018 IEEE/ACM International Conference on Advances in Social Networks Analysis and Mining (ASONAM). IEEE. Online: https://ieeexplore.ieee.org/document/8508698
Khan, Momina Rizwan - Rizvi, Shereen Zehra - Yasin, Amanullah - Ali, Mohsan (2021): Depression Analysis of Social Media Activists Using the Gated Architecture Bi-LSTM. In 2021 International Conference on Cyber Warfare and Security (ICCWS). IEEE. Online: https://ieeexplore.ieee.org/document/9703014
Khan, Nida Saddaf - Ghani, Muhammad Sayeed (2021): A Survey of Deep Learning Based Models for Human Activity Recognition. Wireless Personal Communications, 120(2), 1593-1635. Online: https://doi.org/10.1007/s11277-021-08525-w
Kim, Do-Hyung - López, Guzmán - Kiedanski, Diego - Maduako, Iyke - Ríos, Braulio - Descoins, Alan - Zurutuza, Naroa - Arora, Shilpa - Fabian, Christopher (2021): Bias in Deep Neural Networks in Land Use Characterization for International Development. Remote Sensing, 13(15), 2908. Online: https://doi.org/10.3390/rs13152908
Kira, Kenji - Rendell, Larry A. (1992): A Practical Approach to Feature Selection. In Sleeman, Derek - Edwards, Peter (eds.): Machine Learning Proceedings 1992. Elsevier, 249-256. Online: https://doi.org/10.1016/B978-1-55860-247-2.50037-1
- 46/47 -
Kumar, Chanchal - Bharati, T. S. - Prakash, S. (2021): Online Social Network Security: A Comparative Review Using Machine Learning and Deep Learning. Neural Processing Letters, 53(1), 843-861. Online: https://doi.org/10.1007/s11063-020-10416-3
Lazer, David M. - Pentland, Alex - Watts, Duncan J. - Aral, Sinan - Athey, Susan - Contractor, Noshir - Freelon, Deen - Gonzalez-Bailon, Sandra - King, Gary -Margetts, Helen - Nelson, Alondra - Salganik, Matthew - Strohmaier, Markus - Vespignani, Alessandro - Wagner, Claudia (2020): Computational Social Science: Obstacles and Opportunities. Science, 369(6507), 1060-1062. Online: https://doi.org/10.1126/science.aaz817
Lecun, Yann et al. (2015): Deep Learning. Nature, 521(7553), 436-444. Online: https://doi.org/10.1038/nature14539
Li, Chang - Goldwasser, Dan (2021): Using Social and Linguistic Information to Adapt Pretrained Representations for Political Perspective Identification. In Zong, Chengqing - Xia, Fei - Li, Wenjie - Navigli, Roberto (eds.): Findings of the Association for Computational Linguistics: ACL-IJCNLP 2021, 4569-4579. Online: https://doi.org/10.18653/v1/2021.findings-acl.401
Liu, Yajing (2021): Research on Community Public Service Information Collaborative Governance Based on Deep Learning Model. Journal of Mathematics, 2021. Online: https://doi.org/10.1155/2021/4727617
Liu, Wenhua - Zhang, Yijie (2020): Evaluation Feedback Information for Optimization of Mental Health Courses with Deep Learning Methods. Soft Computing, 24(11), 8275-8283. Online: https://doi.org/10.1007/s00500-019-04569-0
Ludl, Dennis - Gulde, Thomas - Curio, Christóbal (2020): Enhancing Data-Driven Algorithms for Human Pose Estimation and Action Recognition through Simulation. IEEE Transactions on Intelligent Transportation Systems, 21(9), 3990-3999. Online: https://ieeexplore.ieee.org/abstract/document/9082148
Luo, Ren C. - Hsieh, Chung Kai (2017): Robotic Sensory Perception on Human Mentation for Offering Proper Services. In 2017 IEEE International Conference on Multisensor Fusion and Integration for Intelligent Systems (MFI). IEEE. Online: https://ieeexplore.ieee.org/stamp/stamp.jsp?tp=&arnumber=8170374
Ma, Qiulin - Zou, Qi - Huang, Yaping - Wang, Nan (2022): Dynamic Pedestrian Trajectory Forecasting with LSTM-based Delaunay Triangulation. Applied Intelligence, 52(3), 3018-3028. Online: https://doi.org/10.1007/s10489-021-02562-5
Masson, Haemy Lasson - Isik, Leyla (2021): Functional Selectivity for Social Interaction Perception in the Human Superior Temporal Sulcus during Natural Viewing. Neuroimage, 245, 118741. Online: https://doi.org/10.1016/j.neuroimage.2021.118741
Meng, Lingchao - Wen, Khuo-Sun - Zeng, Zhijie - Brewin, Richard - Fan, Xiaolei - Wu, Qiong (2020): The Impact of Street Space Perception Factors on Elderly Health in High-Density Cities in Macau - Analysis Based on Street View Images and Deep Learning Technology. Sustainability, 12(5), 1799. Online: https://doi.org/10.3390/su12051799
- 47/48 -
Miao, Hang - Li, A. - Yang B. (2022): Meta-path Enhanced Lightweight Graph Neural Network for Social Recommendation. In International Conference on Database Systems for Advanced Applications. Springer, 134-149. Online: https://doi.org/10.1007/978-3-031-00126-0_9
Miller, Tim (2019): Explanation in Artificial Intelligence: Insights from the Social Sciences. Artificial Intelligence, 267, 1-38. Online: https://doi.org/10.1016/j.artint.2018.07.007
Moon, Katie - Blackman, Deborah (2014): A Guide to Understanding Social Science Research for Natural Scientists. Conservation Biology, 28(5), 1167-1177. Online: https://doi.org/10.1111/cobi.12326
Nasir, Adeel - Shaukat, Kamran - Khan, Kanwal Iqbal - Hameed, Ibrahim A. - Alam, Talha - Luo, Suhuai (2021): Trends and Directions of Financial Technology (Fintech) in Society and Environment: A Bibliometric Study. Applied Sciences, 11(21), 10353. Online: https://doi.org/10.3390/app112110353
Ni, Qingjian - Zhang, Mei (2022): STGMN: A Gated Multi-Graph Convolutional Network Framework for Traffic Flow Prediction. Applied Intelligence, 2022, 1-14. Online: https://doi.org/10.1007/s10489-022-03224-w
Özerol, Gizem - Selçuk, Semra Arslan (2022): Machine Learning in the Discipline of Architecture: A Review on the Research Trends between 2014 and 2020. International Journal of Architectural Computing, 21(1), 23-41. Online: https://doi.org/10.1177/14780771221100102
Page, Matthew J. - McKenzie, Joanne E. - Bossuyt, Patrick M. - Boutron, Isabelle - Hoffmann, Tammy C. - Mulrow, Cynthia D. et al. (2021): The PRISMA 2020 Statement: An Updated Guideline for Reporting Systematic Reviews. British Medical Journal, 10(1), 1-11. Online: https://doi.org/10.1136/bmj.n71
Palmer, Gregory - Green, Mark - Boyland, Emma - Vasconcelos, Yales Stefano Rios - Savani, Rahul - Singleton, Alex (2021): A Deep Learning Approach to Identify Unhealthy Advertisements in Street View Images. Nature, 11(1), 1-12. Online: https://doi.org/10.1038/s41598-021-84572-4
Poole, David L. - Mackworth, Alan K. (2010): Artificial Intelligence: Foundations of Computational Agents. New York: Cambridge University Press.
Rani, Meesala Shobha - Sumathy, Subramanain(2022): A Study on Diverse Methods and Performance Measures in Sentiment Analysis. Recent Patents on Engineering, 16(3), 12-42. Online: https://doi.org/10.2174/1872212114999201019154954
Ren, Siqi - Zhou, Yue - He, Liming (2018): Human Trajectory Prediction with Social Information Encoding. In Pattern Recognition and Computer Vision: First Chinese Conference, PRCV 2018, Guangzhou, China, November 23-26, Springer, 262-273. Online: https://dl.acm.org/doi/10.1007/978-3-030-03398-9_23
Selçuk, Ayşe Adin (2019): A Guide for Systematic Reviews: PRISMA. Turkish Archives of Otorhinolaryngology, 57(1), 57-58. Online: https://doi.org/10.5152%2Ftao.2019.4058
- 48/49 -
Shukla, Priya - Bhandari, Bhanu - Goel, Aditya - Charan, Ravi - Gali, Niharika - Dwivedi, Agam - Mundra, Nikhil - Agrawal, Ruchin - Nandi, G. C. (2019): Fusing Multimodal Human-Robot Communication using Deep Learning. In 2019 International Conference on Electrical, Electronics and Computer Engineering (UPCON). IEEE. Online: https://ieeexplore.ieee.org/stamp/stamp.jsp?tp=&arnumber=8980213
Thang, Do Nam - Nguyen, Lan Anh - Dung, Pham Trung - Khoa, Truong Dang - Son, Nguyen Huu - Hiep, Nguyen Tran et al. (2018): Deep Learning-Based Multiple Objects Detection and Tracking System for Socially Aware Mobile Robot Navigation Framework. In 5[th] NAFOSTED Conference on Information and Computer Science (NICS). IEEE. Online: https://ieeexplore.ieee.org/stamp/stamp.jsp?tp=&arnumber=8606878
Tirdad, Kayvan - Dela Cruz, Alex - Sadeghian, Alireza - Cusimano, Michael (2021): A Deep Neural Network Approach for Sentiment Analysis of Medically Related Texts: An Analysis of Tweets Related to Concussions in Sports. Brain Informatics, 8(1), 1-17. Online: https://doi.org/10.1186/s40708-021-00134-4
Tsiktsiris, Dimitris - Dimitriou, Nikolaos - Lalas, Antonios - Dasygenis, Minas - Votis, Konstantinos - Tzovaras, Dimitrios (2020): Real-time Abnormal Event Detection for Enhanced Security in Autonomous Shuttles Mobility Infrastructures. Sensors, 20(17), 4943. Online: https://doi.org/10.3390/s20174943
Xiao, Jian - Wang, Jia - Cao, Shaozhong - Li, Bilong (2020): Application of a Novel and Improved VGG-19 Network in the Detection of Workers Wearing Masks. Journal of Physics: Conference Series, 1518. Online: https://doi.org/10.1088/1742-6596/1518/1/012041
Xingxing, Ye et al. (2021): POI Recommendation Based on Graph Enhanced Attention GNN. In 2021 11th International Conference on Intelligent Control and Information Processing (ICICIP). IEEE. Online: https://ieeexplore.ieee.org/document/9642167
Wu, Qiong - Wu, Muhong - Chen, Xu - Zhou, Zhi - He, Kaiwen - Chen, Liang (2020): DeepCP: Deep Learning Driven Cascade Prediction-Based Autonomous Content Placement in Closed Social Network. IEEE Journal on Selected Areas in Communications, 38(7), 1570-1583. Online: https://ieeexplore.ieee.org/stamp/stamp.jsp?tp=&arnumber=9107092
Zamboni, Simone - Kefato, Zekarias Tilahun - Girdzitauskas, Sarunas - Noren, Christoffer - Dal Col, Laura (2022): Pedestrian Trajectory Prediction with Convolutional Neural Networks. Pattern Recognition, 121, 108252. Online: https://doi.org/10.1016/j.patcog.2021.108252
Zhang, Han - Pan, Jennifer (2019): CASM: A Deep-Learning Approach for Identifying Collective Action Events with Text and Image Data from Social Media. Sociological Methodology, 49(1), 1-57. Online: https://doi.org/10.1177/0081175019860244
- 49/50 -
Zhang, Jie (2018): Theory and Application of Deep Neural Networks in Future Deep Space Autonomous Exploration Mission. 16[th] IAA Symposium On Visions and Strategies for the Future. Proceedings of the International Astronautical Congress. Online: https://iafastro.directory/iac/archive/browse/IAC-18/D4/1/47408/
Zhang, Jiyong - Liu, Xin - Zhou, Xiaofei (2022): Towards Non-Linear Social Recommendation Using Gaussian Process. IEEE Access, 10, 6028-6041. Online: https://doi.org/10.1109/ACCESS.2022.3141795
Zhang, Jun - Wang, Wei - Xia, Feng - Lin, Yu-Ru - Tong, Hanghang (2020): Data-driven Computational Social Science: A Survey. Big Data Research, 21, 100145. Online: https://doi.org/10.1016/j.bdr.2020.100145
Zhang, Yan - Chen, Zeqiang - Zheng, Xiang - Chen, Nengcheng - Wang, Yongqiang (2021): Extracting the Location of Flooding Events in Urban Systems and Analyzing the Semantic Risk Using Social Sensing Data. Journal of Hydrology, 603, 127053. Online: https://doi.org/10.1016/j.jhydrol.2021.127053
Zhao, Heng - Yap, Kim-Hui - Kot, Alex Chichung - Duan, Lingyu (2020): Jdnet: A Joint-Learning Distilled Network for Mobile Visual Food Recognition. IEEE Journal of Selected Topics in Signal Processing, 14(4), 665-675. Online: https://doi.org/10.1109/JSTSP.2020.2969328
Zhao, Yinou - Liu, Chi Harold (2020): Social-Aware Incentive Mechanism for Vehicular Crowdsensing by Deep Reinforcement Learning. IEEE Transactions on Intelligent Transportation Systems, 22(4), 2314-2325. Online: https://doi.org/10.1109/TITS.2020.3014263
Zheng, Li - Liao, Pan - Luo, Shen - Sheng, Jingwei - Teng, Pengfei - Luan, Guoming -Gao, Jia-Hong (2019): EMS-net: A Deep Learning Method for Autodetecting Epileptic Magnetoencephalography Spikes. IEEE Transactions on Medical Imaging, 39(6), 18331844. Online: https://doi.org/10.1109/tmi.2019.2958699
Zhou, Hao - He, Shenjing - Cai, Yuyang - Wang, Miao - Su, Shiliang (2019): Social Inequalities in Neighborhood Visual Walkability: Using Street View Imagery and Deep Learning Technologies to Facilitate Healthy City Planning. Sustainable Cities and Society, 50, 101605. Online: https://doi.org/10.1016/j.scs.2019.101605
Sina Ardabili is a Research Fellow at the Ludovika University of Public Service Institute of the Information Society. He had been among the top 2% scientists based on the Stanford University study since 2021. His research interest include smart systems and artificial intelligence. His research during PhD studies has been on the application of artificial intelligence systems and smart systems. He has several highly cited review papers on the application of machine learning and deep learning systems. His latest book is Autonomous Agricultural Vehicles: Concepts, Principles, Components, and Development Guidelines. CRC Press, 2023.
- 50/51 -
Amir Mosavi is a Research Fellow at the Ludovika University of Public Service Institute of the Information Society. His research interests include applied artificial intelligence. He was an Alexander von Humboldt fellow and the recipient of the Marie Skłodowska-Curie and the European Research Consortium for Informatics and Mathematics fellowships.
Csaba Makó, Professor, Institute of the Information Society, Ludovika University of Public Service, Budapest, Hungary. Research interest: international comparative analysis of the social - economic institutions/regulations of the game-changing technological (digitisation, smart automatisation, artificial intelligence and algorithmic management) and organisational innovations. Special focus of his research interest is related with quality of work, skills formation and employment status. Latest major project: "Democracy at Work Through Transparent and Inclusive Algorithmic Management" (INCODING), EU, 2021-2024.
Péter Sasvári, PhD, Associate Professor (2013) of the Department of Public Management and Information Technology, Faculty of Public Governance and International Studies, Ludovika University of Public Service, Budapest, Hungary (Part time: University of Miskolc, Hungary). He obtained his doctoral thesis with the best receivable mark, "summa cum laude". The title of his dissertation was The Development of Information and Communication Technology: An Empirical Study. Sasvári is the supervisor of 4 PhD students' theses, has supervised more than 150 bachelor's and master's theses; he is a member of the public body at the Hungarian Academy of Sciences. He is the author of more than 90 international publications, serves as the associate editor for 3 international journals. Scientometrics has been in the focus of his researches, recently. With the co-operation of some local universities, he has conducted a primary research among small and medium-sized enterprises in Austria, Bosnia-Herzegovina, the Czech Republic, Croatia, Poland, Portugal, Hungary, Germany, Italy, Spain and Slovakia. ■
NOTES
[1] Miller 2019; Grimmer et al. 2021; Buyalskaya et al. 2021.
[2] Lazer et al. 2020; Moon-Blackman 2014.
[3] Hofman et al. 2021; Galesic et al. 2021; Zhang et al. 2020.
[4] Poole-Mackworth 2010; Al-Sartawi 2021.
[5] Lecun et al. 2015; Goodfellow et al. 2016.
[6] Page et al. 2021.
[7] Zhang et al. 2021.
[8] Cui et al. 2021.
[9] Chu et al. 2021.
[10] Khan et al. 2021.
[11] Ludl et al. 2020.
[12] Wu et al. 2020.
[13] Bai-Cheng 2020.
[14] Band et al. 2022.
[15] Tirdad et al. 2021.
[16] Li-Goldwasser 2021.
[17] Khaefi et al. 2018.
[18] Kira-Rendell 1992.
[19] Kira-Rendell 1992.
Lábjegyzetek:
[1] The author is research Fellow, Ludovika University of Public Service, Institute of the Information Society, s.ardabili@ieee.org
[2] The author is research Fellow, Ludovika University of Public Service, Institute of the Information Society, Mosavi.Amirhosein@uni-nke.hu
[3] The author is professor, Ludovika University of Public Service, Institute of the Information Society, mako.csaba@uni-nke.hu
[4] The author is associate Professor, Ludovika University of Public Service, Faculty of Public Governance and International Studies, Department of Public Management and Information Technology, University of Miskolc, Faculty of Mechanical Engineering and Informatics, Institute of Information Science, sasvari.peter@uni-nke.hu